Amplifying Data
Data gives us opportunties to create stories which will engage the users. Data is very important part of the design process. It’s essential to try and include data in our designs. Many websites and social media platforms collect data on their users when they frist sign up or use the site. Data is used everywhere. Data can be used to advertise products based on interests.
Migrating figues, referenda, election campigans and pays scales. e.g the national minmuim wages are examples were data is used.
A good example of a visual data is the recent covid 19 which keeps on track the daily cases.
Kyle says we could consider using data to present the Apollo project.
Sanctions Tracker by Enigma
This website tracks the USA Sanctions from 1994-2019. This allows you to visualise the sanctions on a country and theme. It tracker is used to present data clearly to the user. This site uses dots and colours which is a good way of presenting the data.
![]()
Practice what your preach
Another Two Examples were:
Lightyear
Business simulation.com
Using colour, layout, shapes are excellent ways of presenting data.
Trailblazers or Inspriations
David McCandless– A designer and data- journalist who works for local newspaper. He is great at visualising data in an interesting way. He does alot of charts/diagrams for the newspaper.


Manuel Lima- A designer and aunthor of 3 best selling book. He trains creative designers and companys on creating digital user experiences.

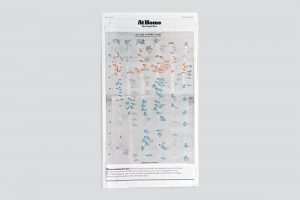
Giorgia Lupi– An information Designer. who works with data and storytelling were creates innovated designs in a unique way. She created a hand drawn visual data poster about the Pandemic and her life at home before and after lockdown. This was posted in the New York Times.


Brendan Dawes- A uk based Artist and designer. His works involves data, machine learning and alogrithms to create interactive experiences, data visulaisations and posters for users both online and print.

Article: The Moon Miracle by the Telepgraph (“50 reasons why the Mission should never have happened”) This article shows data visually. They clearly wanted to put the data of the moon landing into everyday context.

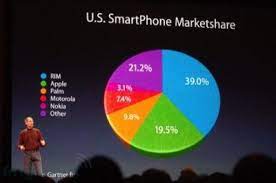
Article by Guardian “Lies, damn lies and Steve Jobs Keynotes”

Apple clearly make the slice of the pie appear bigger which is a good sales techique.
User Interview– The stat of user research in 2022

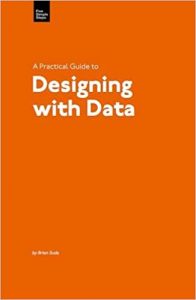
Book: A practical guide to design with data.

Six Key principles of Chart Design:
- Be Honest
- Lend a helping hand
- Delight users
- give clarity of focus
- embrace scale
- provide structure
Tools and Libraries can be used to create charts. A good website to hep create a chart which can be used in webflow is chart.js.

The most important things to remember:
- Keep data truthful
- incorrupt data in your design
- visualise data
- bring these together
This week:
- Carry out research.
- Work on website on webflow
- make changes to my prototype
Reflection
Overall I enjoyed the lecture. The examples shown were really interesting and I would like to look further at different designers and how they respresent data clearly in their work. I’ll gone to try include the use some of the point I learned and work I was shown to visualise data in my website which will interest my users in clear and understandable way.
