
During Week 7 and 8 we were asked to reproduce the images of visual data and bar charts as accurately as possible. This will go together alongside the infographic research.
Below is the orginal Images of the 2 bar charts and another infographic.
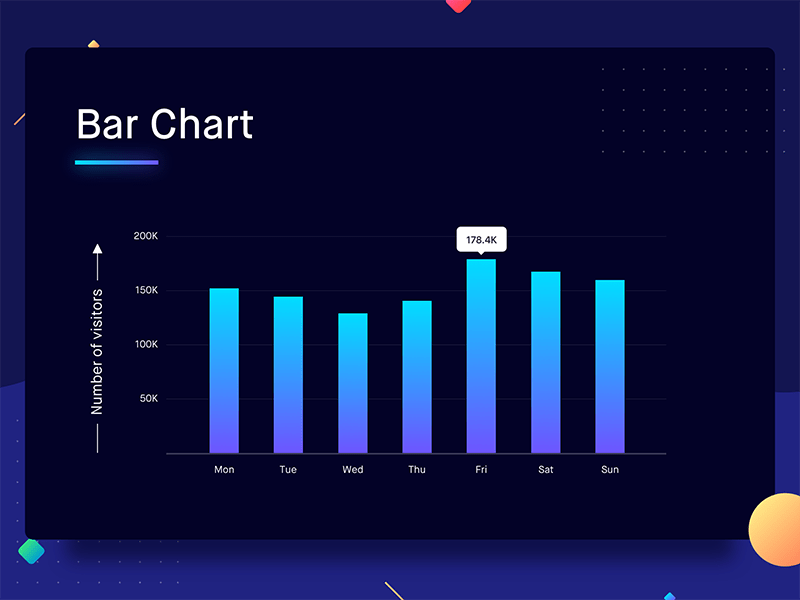


These next 3 Images are my attempt at reproducing the orginal infographic images as best I could.


Hopefully by completely these designs, it will help we visually display data when designing my own infographic posters. These Master-Apprentice Excercises were fun and interesting as it allowed me be creative in attempting these range of charts.