IxD104 – Infographic Master Apprentice Exercises
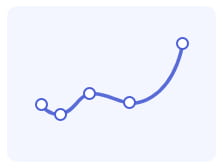
Our new area of focus for IxD104 is infographics and data visualisation. I am so excited to start this project, as I count myself as a bit of a number nerd and love learning new facts about random topics. I knew that to get the best start off for having the skills to design an infographic, I would need to gain some experience. Paul challenged us to recreate some of these data visualisation examples as seen below. Because I had never tried anything like this before, I did find it quite tricky to get the curved lines and pie charts going, however after a couple of youtube videos and discovering the actual graph button on Adobe Illustrator, I really started to enjoy recreating these examples.
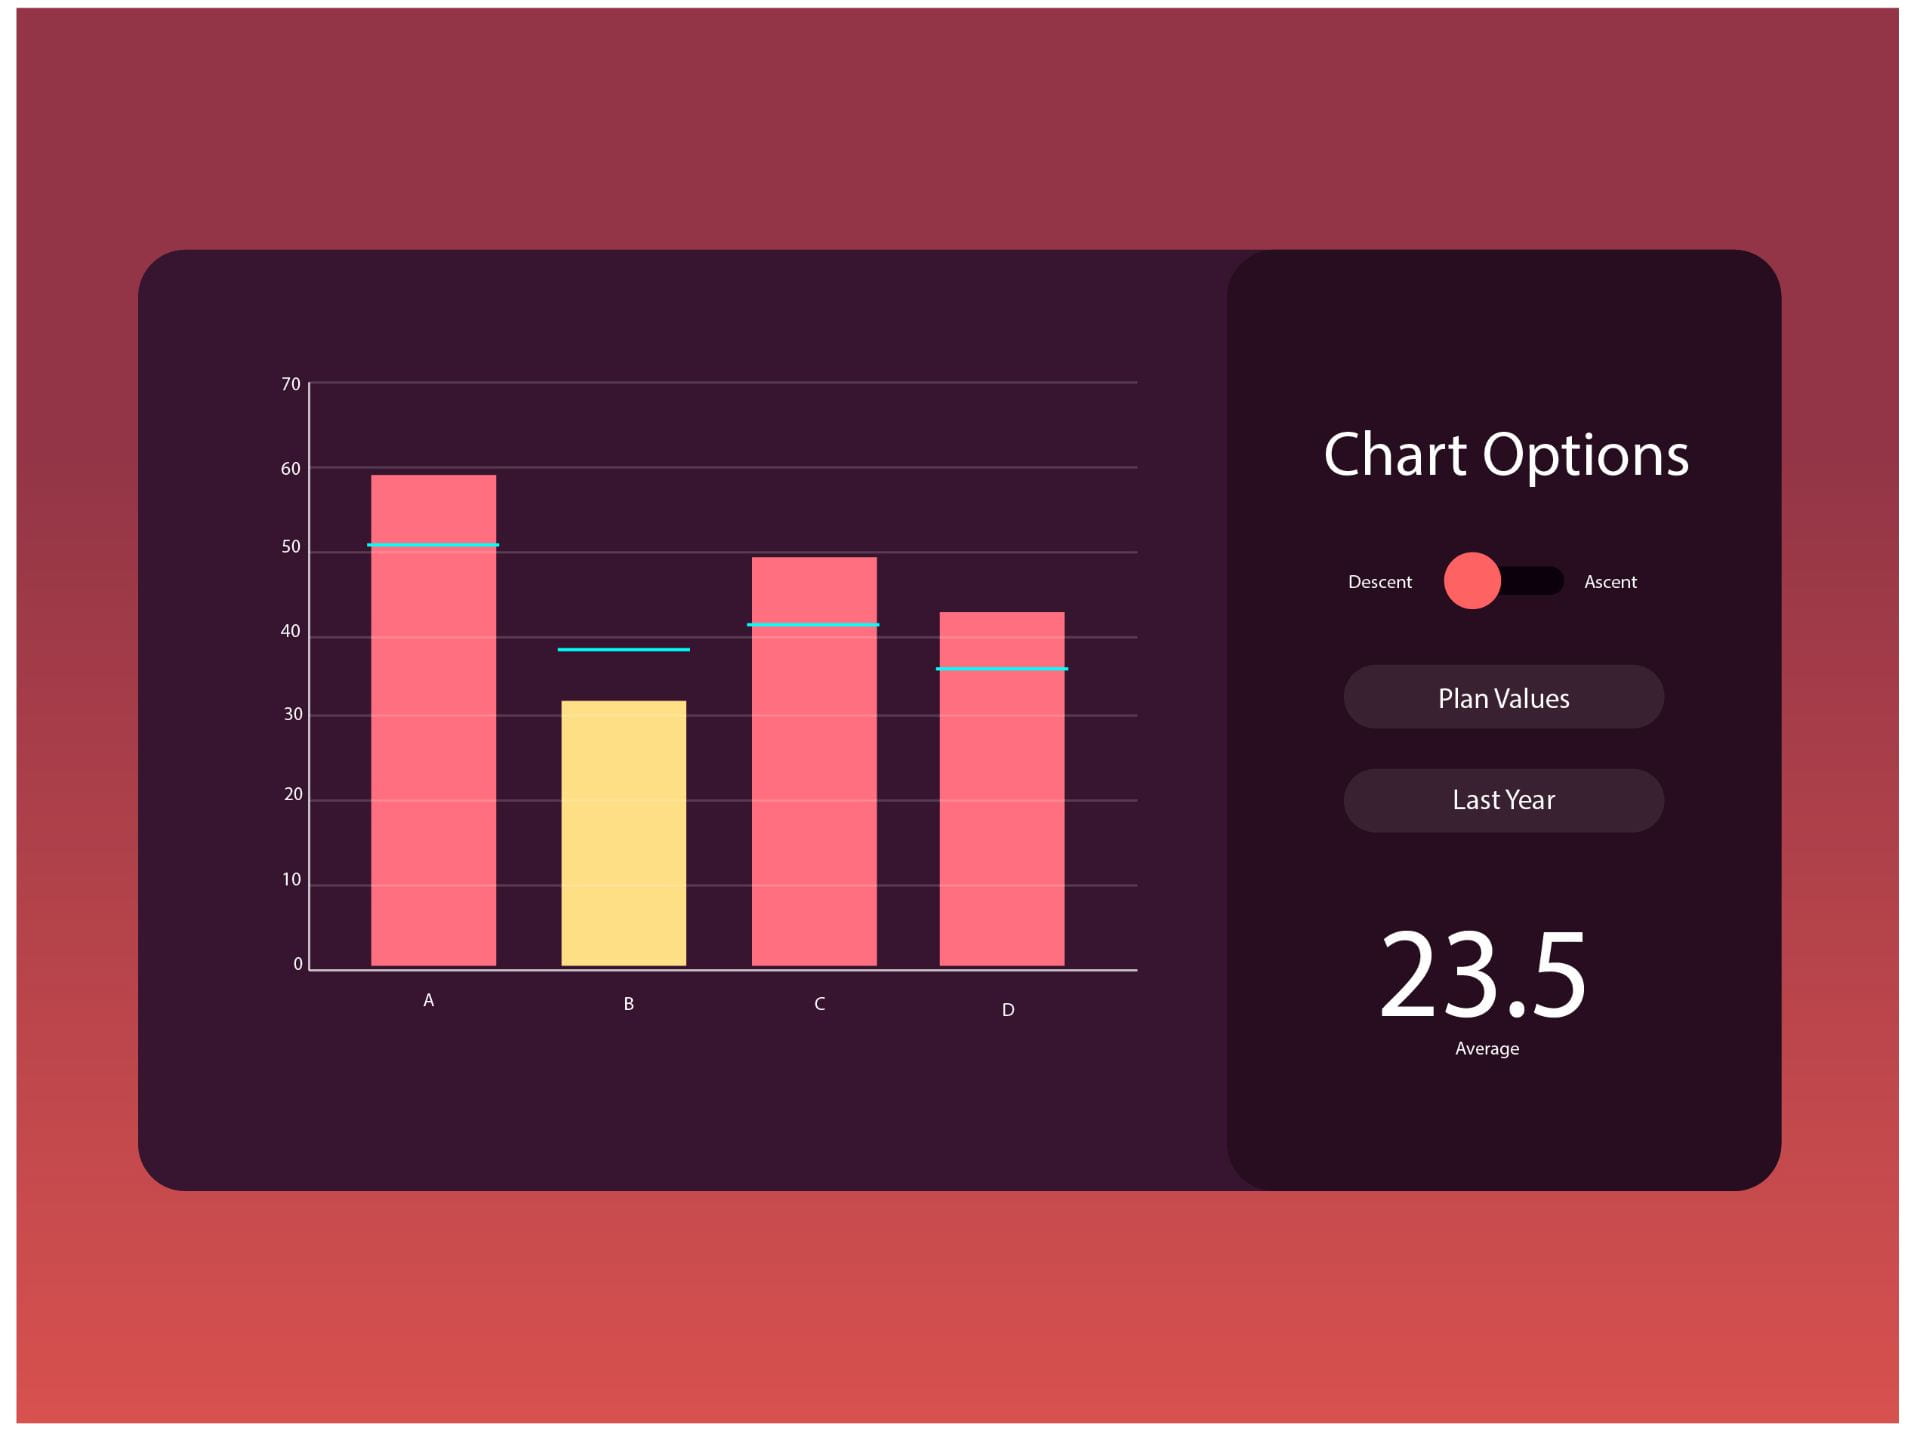
Example –
 My Recreation –
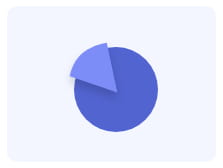

![]()
![]()

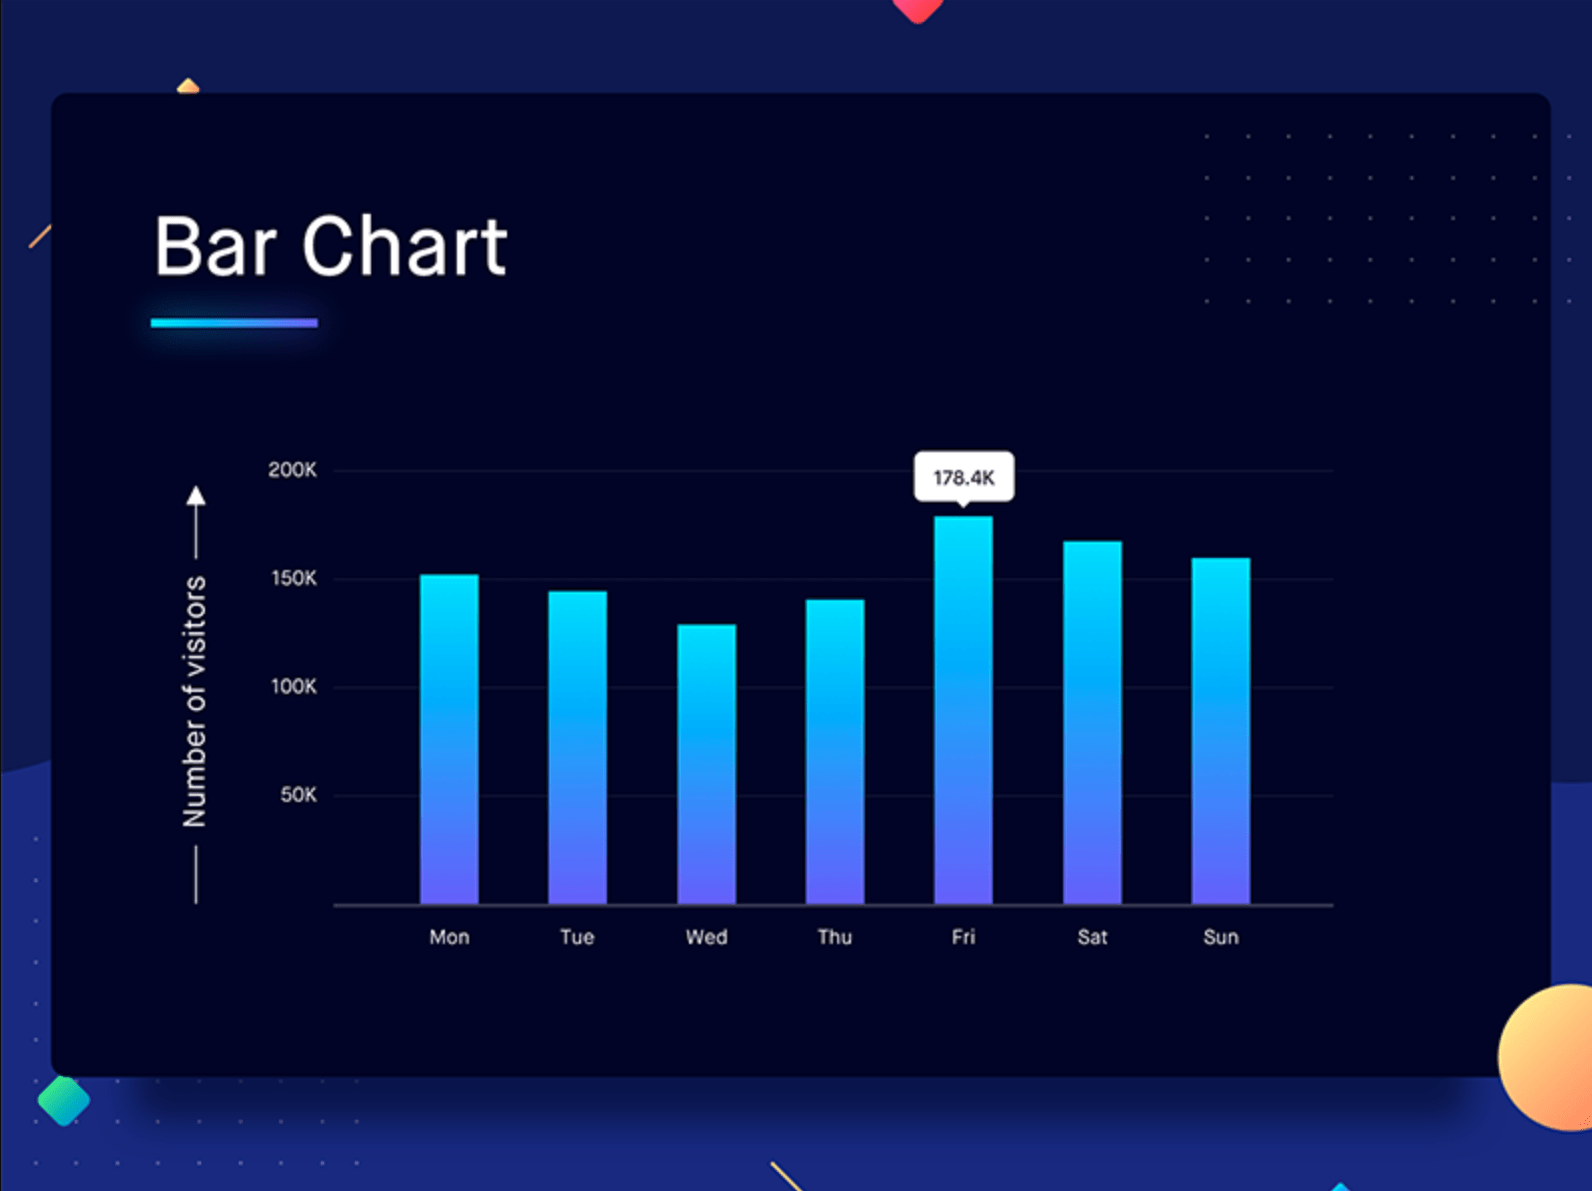
Example –
My Recreation –

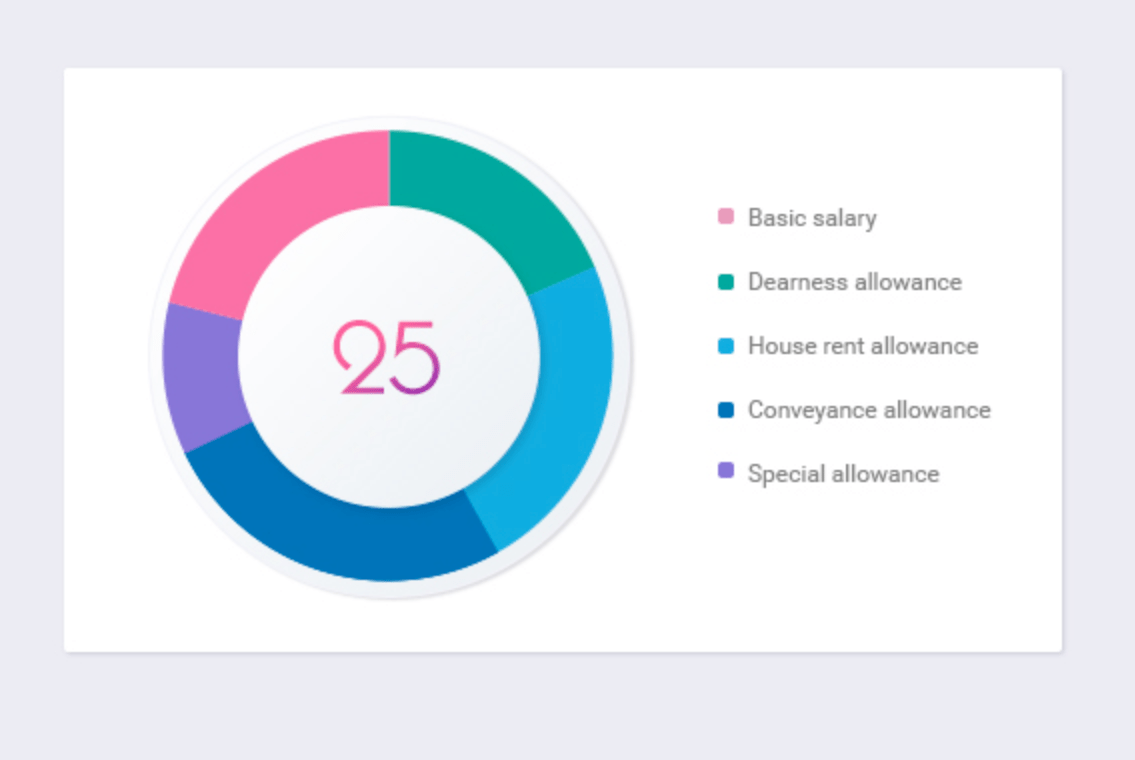
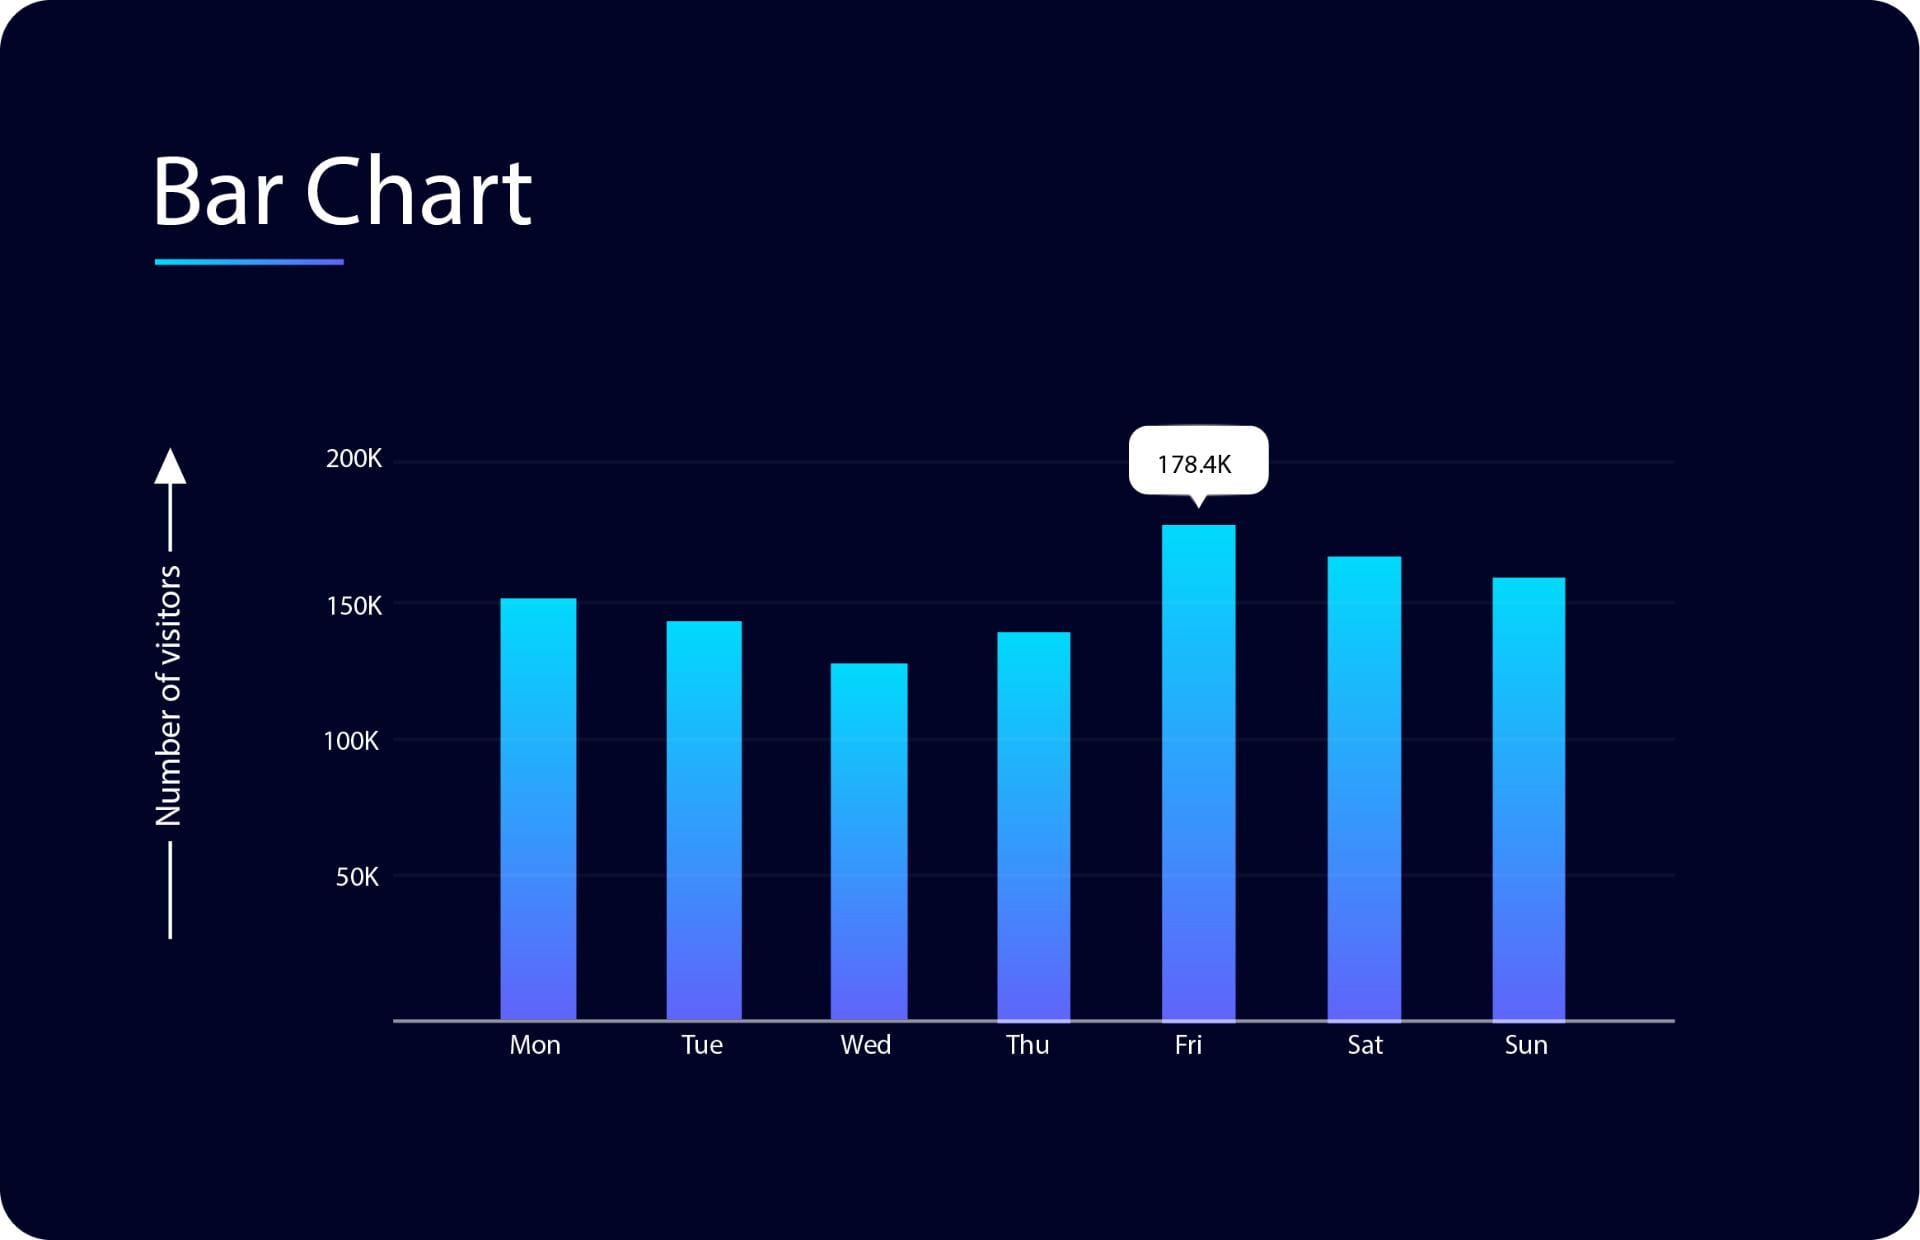
Example –
 My Recreation –
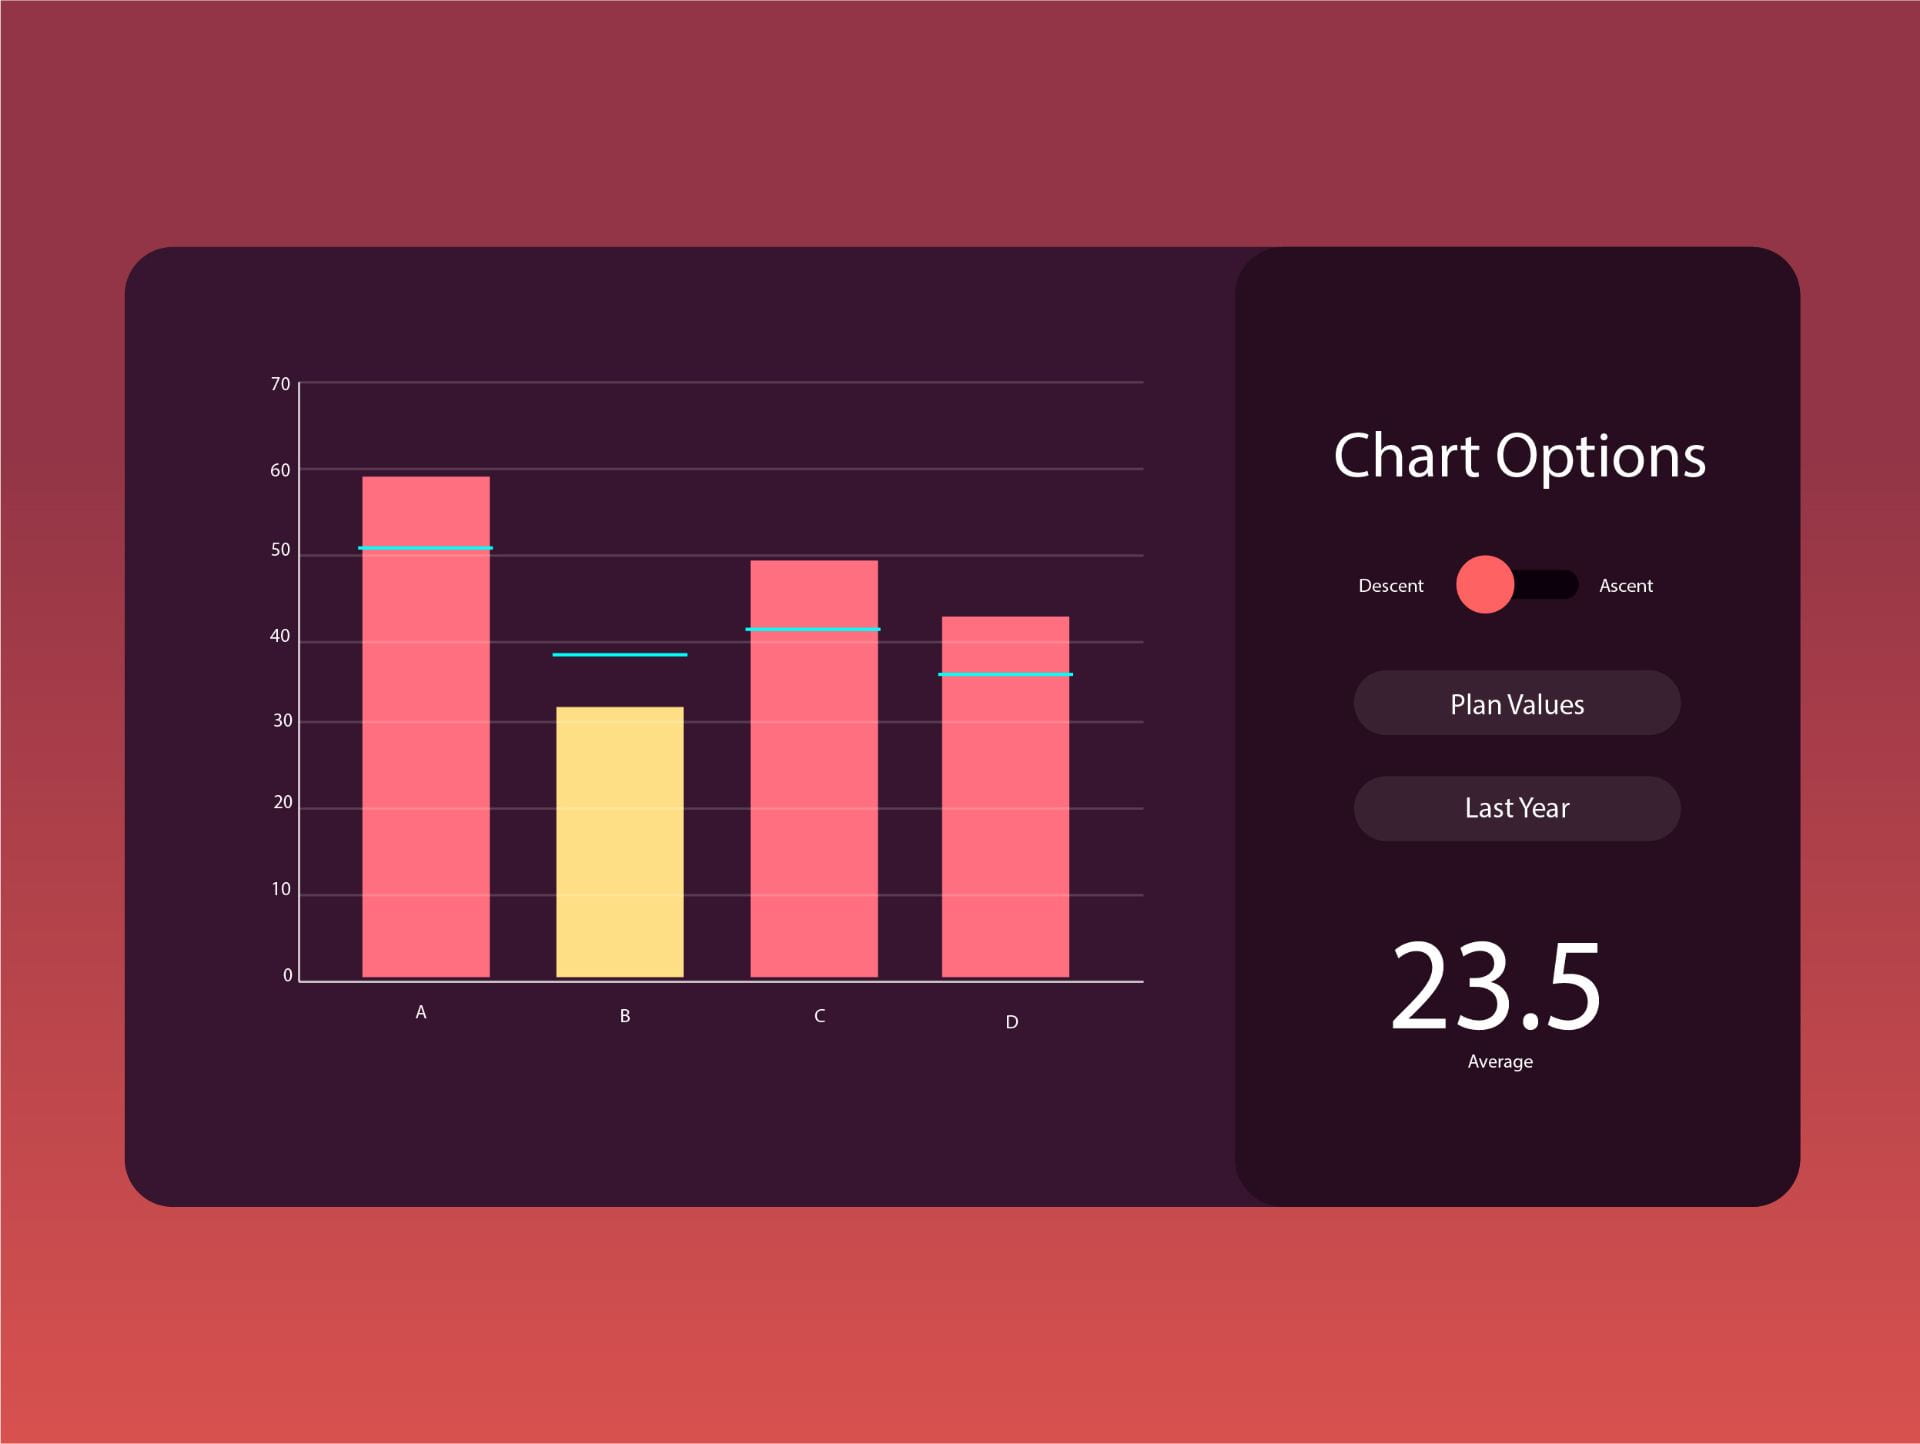
Example –
My Recreation –
Example –

My Recreation –

Reflection –
I am really happy with how they have turned out and I am excited to see what I can come up with for my own Infographic.