Visualizing Data
This week we kicked off with the second and final set of content for the module, exploring visualizing data.
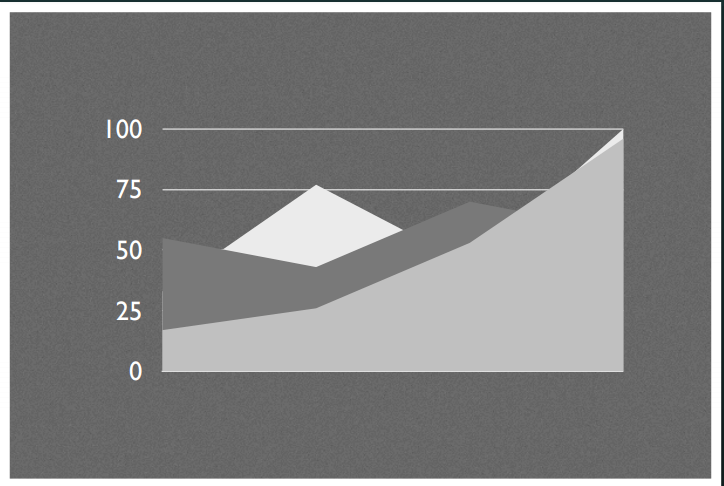
We introduced infographics, exploring how – in an attention-deficit culture – we need to condense information down into easy-to-parse visuals. We explored how infographics have evolved, particularly highlighting the fact that – in fact – infographics have been in use.
- Data’s All Around Us
- Lies, Damned Lies and Statistics
- Research Inspiration
- Your tasks…
Data Around Us:
“The commonality between science and art is in trying to see profoundly – to develop strategies of seeing and showing.”
—Edward Tufte
Diagrams:
Visualizations:
Data’s Everywhere
• Bus Timetables
• Company Forecasts, Profit and Loss
• Election Results
• Sales Figures
• Weather Reports


