The Art of Information:
What we covered:
- The Art of Information
- Big Data
- Small Talks
- Hand In & Group Critique
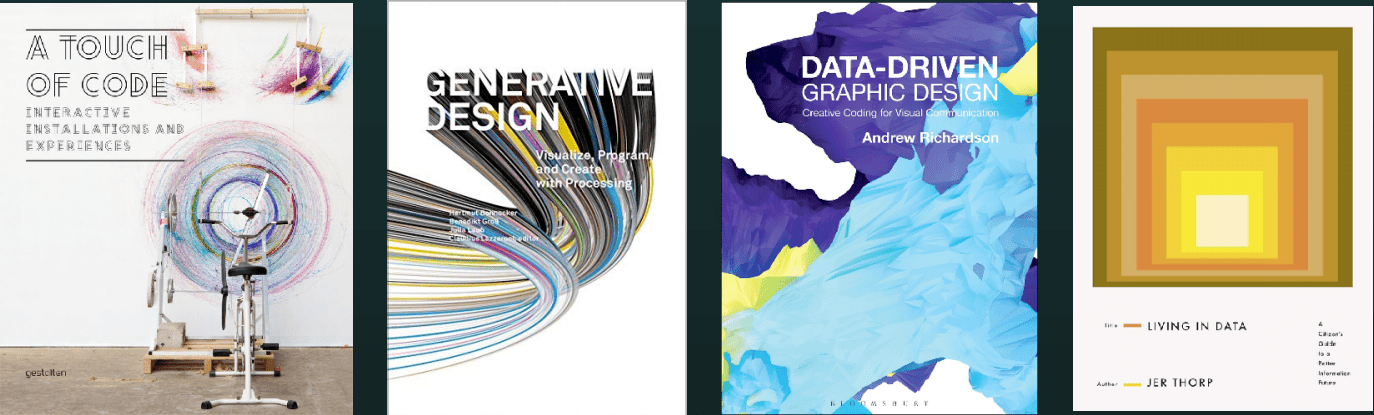
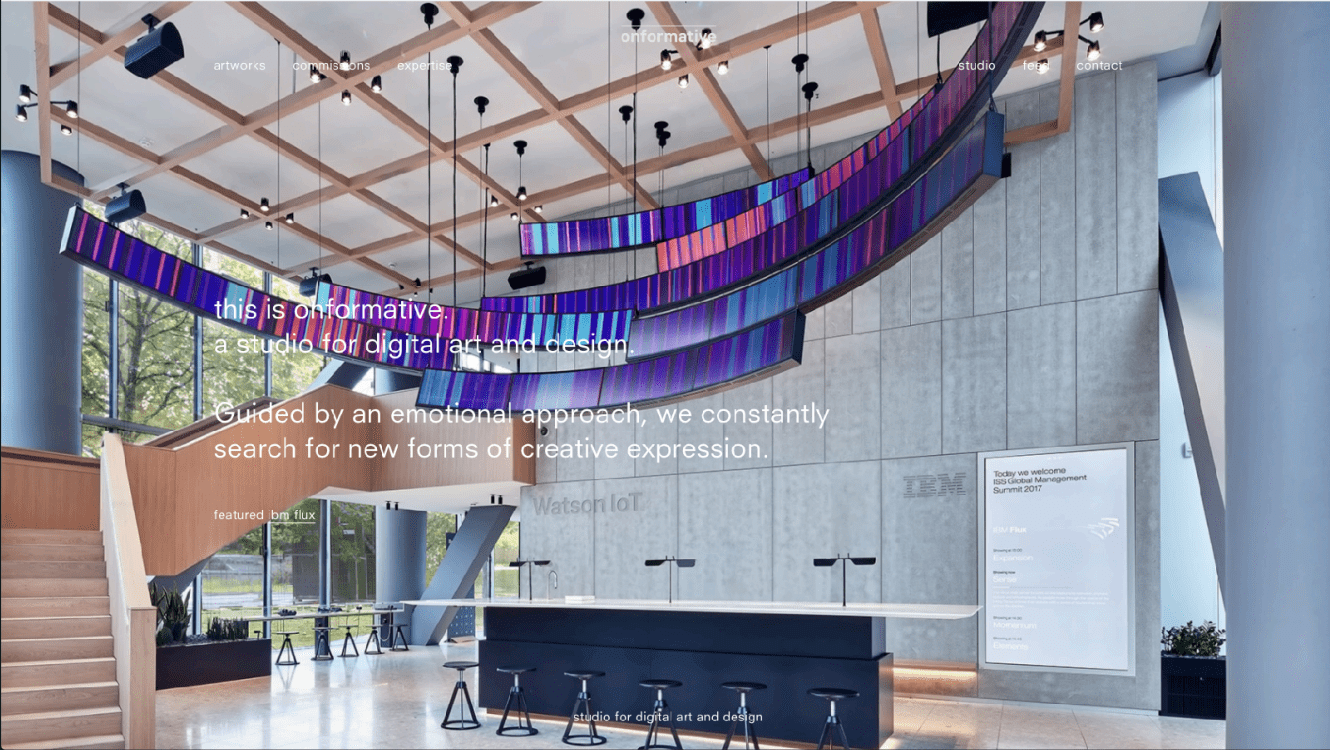
This week we looked at how designers can abstractly use information and data to create beautiful works of art and eyecatching ways of displaying them. Paul showed us a lot of live installations by artists that visually represent data or update to show data as time changes. This is something I’ve seen in a couple of galleries with audio changing depending on where people are walking or how they stand along with visual representations. Another one of the favorites that I saw was a project by Robin Price where he initially created a led ping pong table that eventually he adapted to display information on everyone whos played on it using shapes, sound, and the lights.
We then looked at “Big Data” a phrase used to describe the large amounts of data used by companies to track their productivity and their customer’s needs. Websites such as Netflix use this to pick out movies that you’d like or google who uses It to tailor ads for your personality. We then looked at a couple of designers who took and manipulated this work to make it understandable