To start the semester off, Kyle has given us a seemingly relatively simple task to complete which involves looking up keywords for our personal portfolio website in Google Trends. In order to get the most accurate statistics, I will be looking at the data from the start of Jan 2020 with the location set to the UK in order to get the most accurate, geo-located and recent results.
Why use Google Trends?
Google Trends are a useful analytical tool to investigate a wide range of questions. Google Trends can be used to uncover certain trends from a specific time period. It ultimately tells us how the public interests shift as a story unfolds.
Brainstorming
Before start using Google trends, I need a good starting ground to start developing the many keywords I want to look at while discussing distinct topic areas around the main question so I am confident that all areas are covered. So I’ve written down keywords that are relevant to that topic/position. The positions are UX and UI designers.
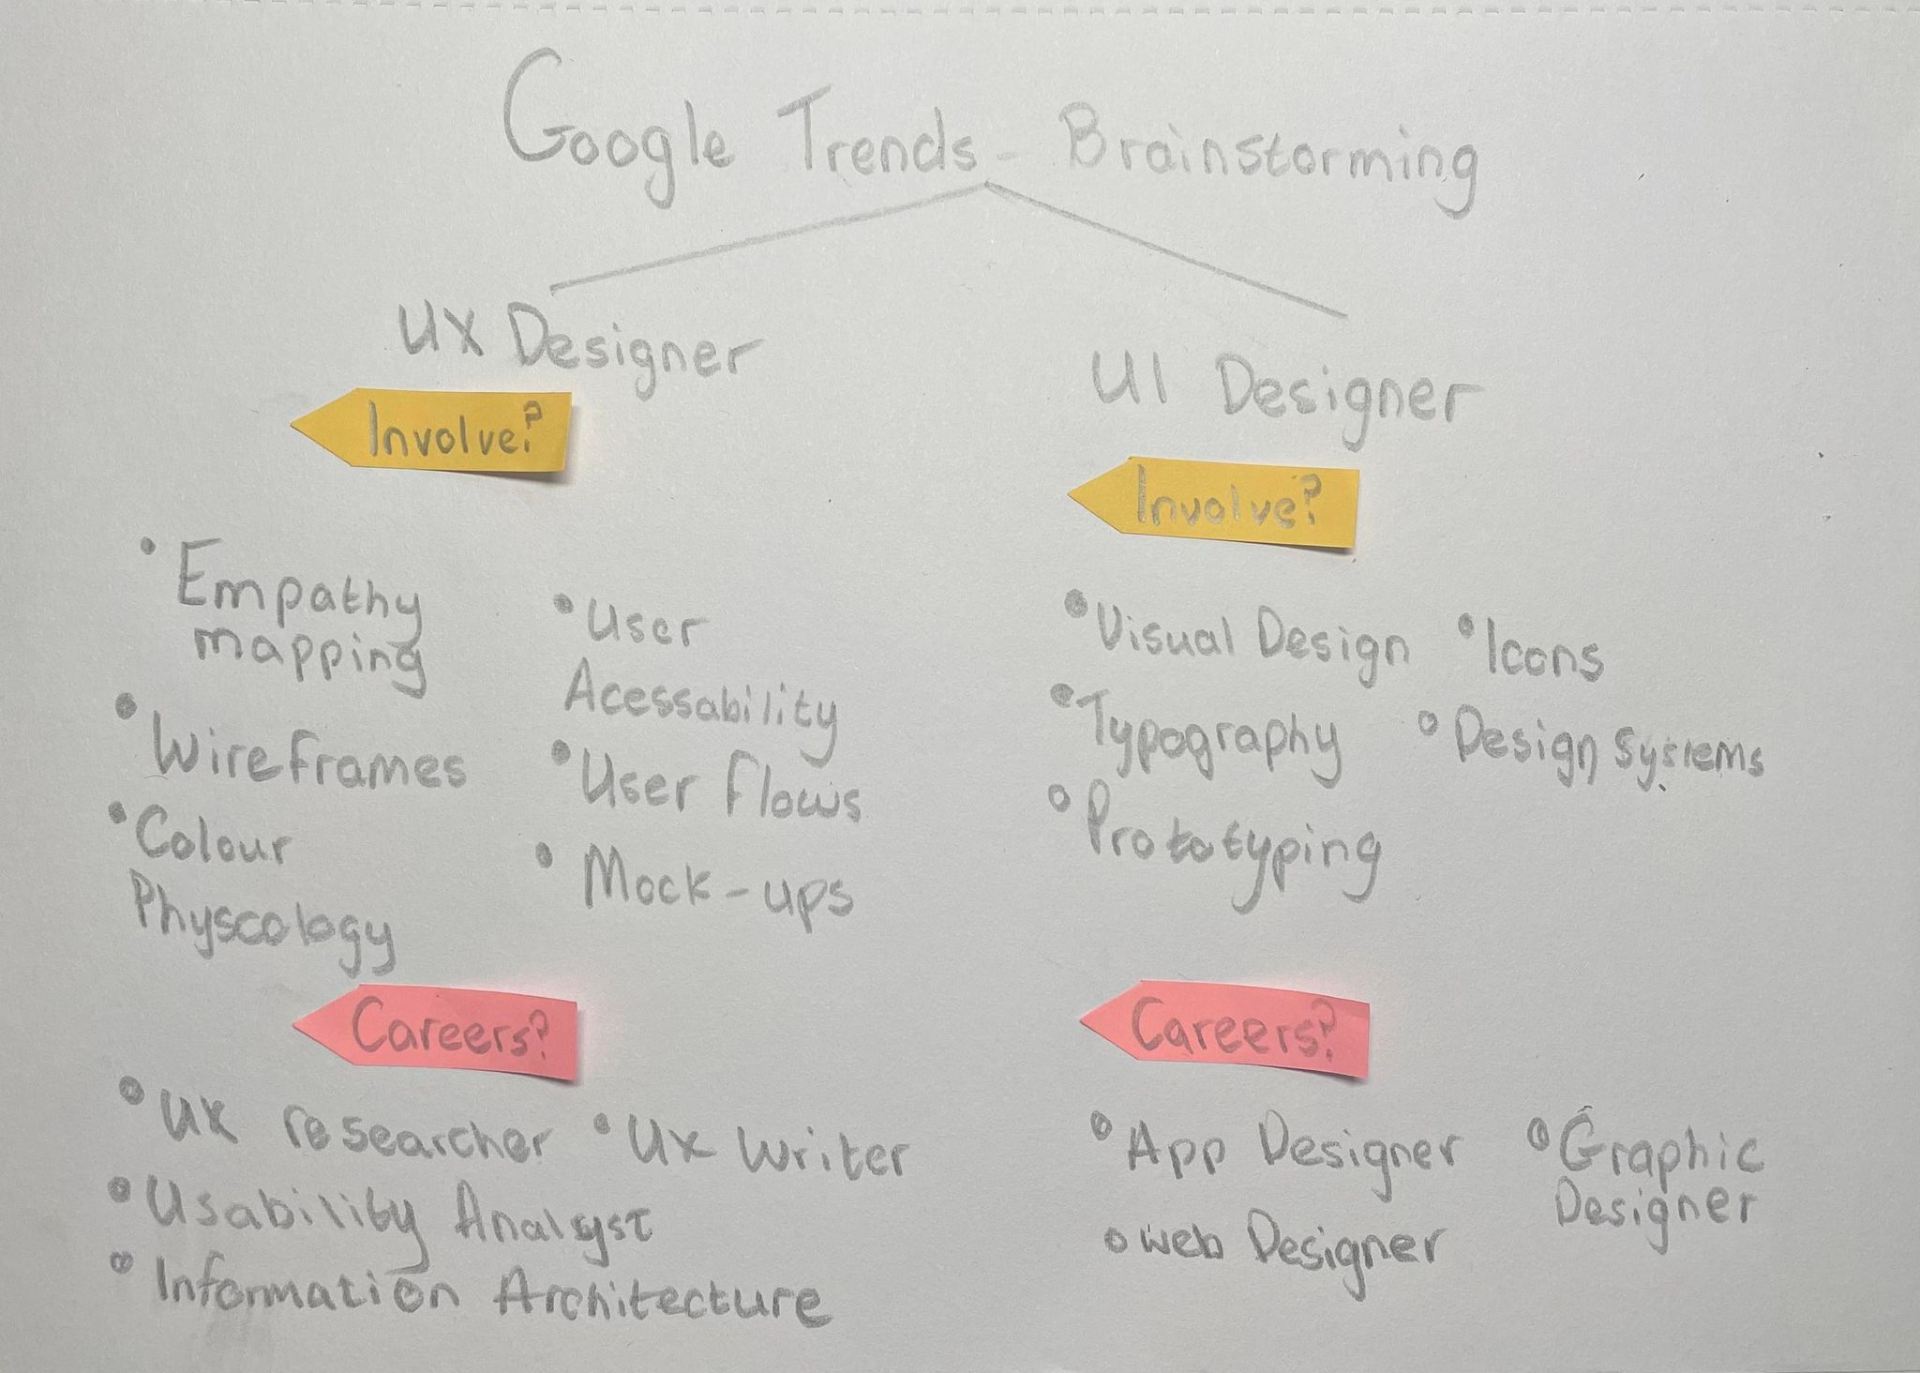
As mentioned above, I’ve created two main areas to look at UX & UI. I then started to dissect each area into both involvement/skills and prominent careers. This way I get a better overall understanding of the relevant information I need to know for these two areas. As I like both UX and UI I think these were good topics to look into.
Looking at the data…

UX
The UX designer field showed being the most popular of all other results with a large following in Northern Ireland and Wales with even more prominence in both Scotland and England. Although, one thing I found for the UX Designer Trend was it was slowly on the decline from the start of the year. However, we can see that the UX Researcher has steadily increased this year alone. However, the UX writer seems to contain limited data which doesn’t contribute to anything.
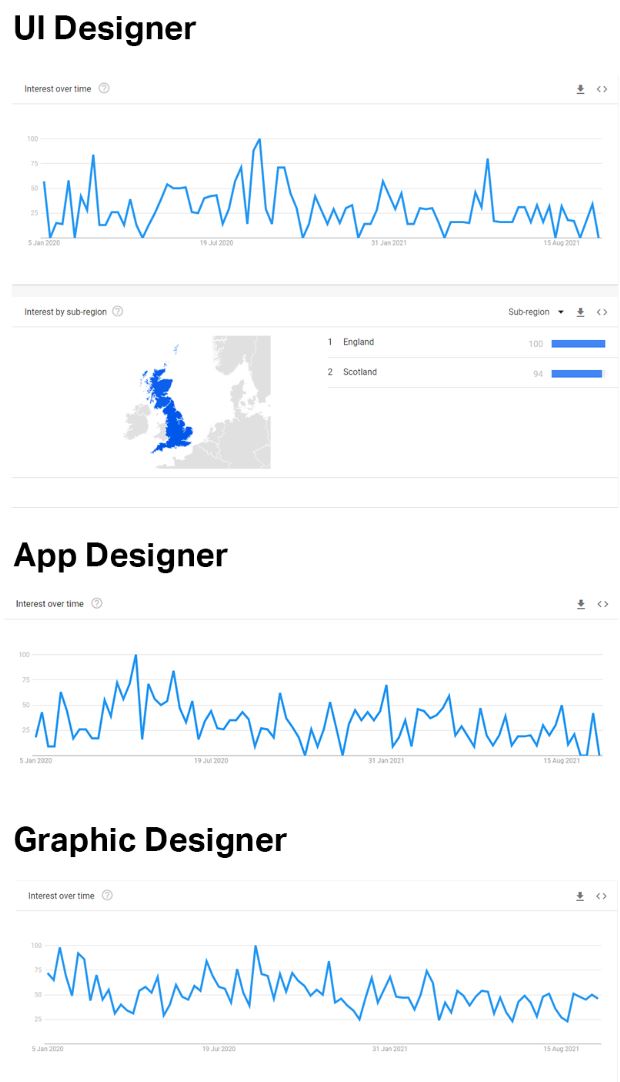
Similarly to the UX Designer search, we can see that a large number of searches contributed to all three such as UI designer, app designer, and graphic designer. However, still, we can see a gradual decline in all three of them over the course of 9 months. Perhaps covid has a part to play in this? Given these statistics, we can see that it is still pretty popular in the United Kingdom with more of a focus in Scotland and Wales.
What have I learned?
Today’s task was an interesting task to start the semester. It has allowed me to acquire a new tool of UX designer I never even knew existed. Additionally, it’s key to design the project with the strengths and limitations of the data source in mind. By delicately combining new types of data together we can get some great results from it.