
Visualising Data Project
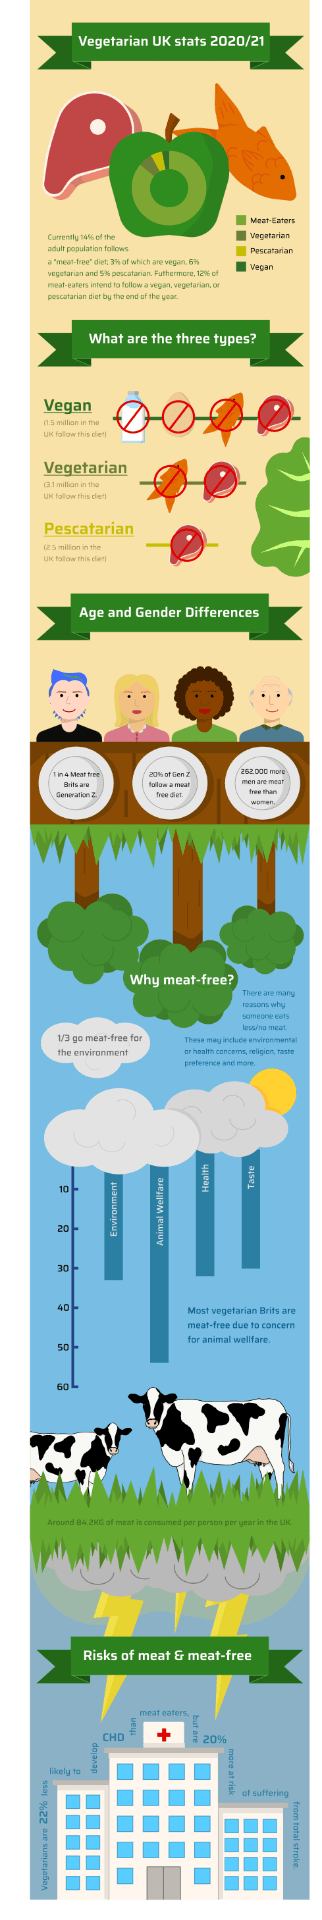
I have spent the last week and a bit designing and digitally drawing my infographic about diet trends in the UK. I illustrated the infographic on figma, and have included my first draft on this post. I’ve also sent it to Paul for some feedback so I can make the necessary changes over the next few days.
Leave a Reply