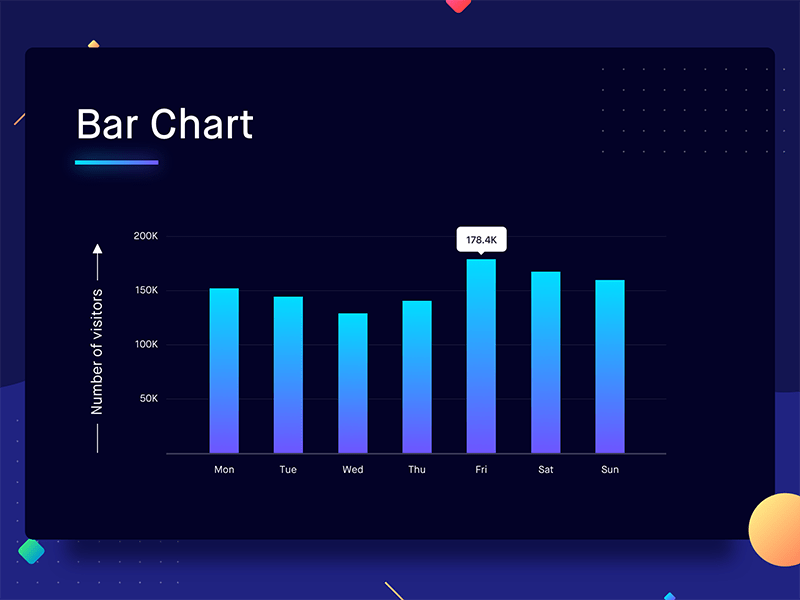
#Task – Recreate the following Master-Apprentice data chart exercises as accurately to the original image as possible.
Week 7
Original Images:


My Recreation:


Week 8
Original Images:


My Recreation: 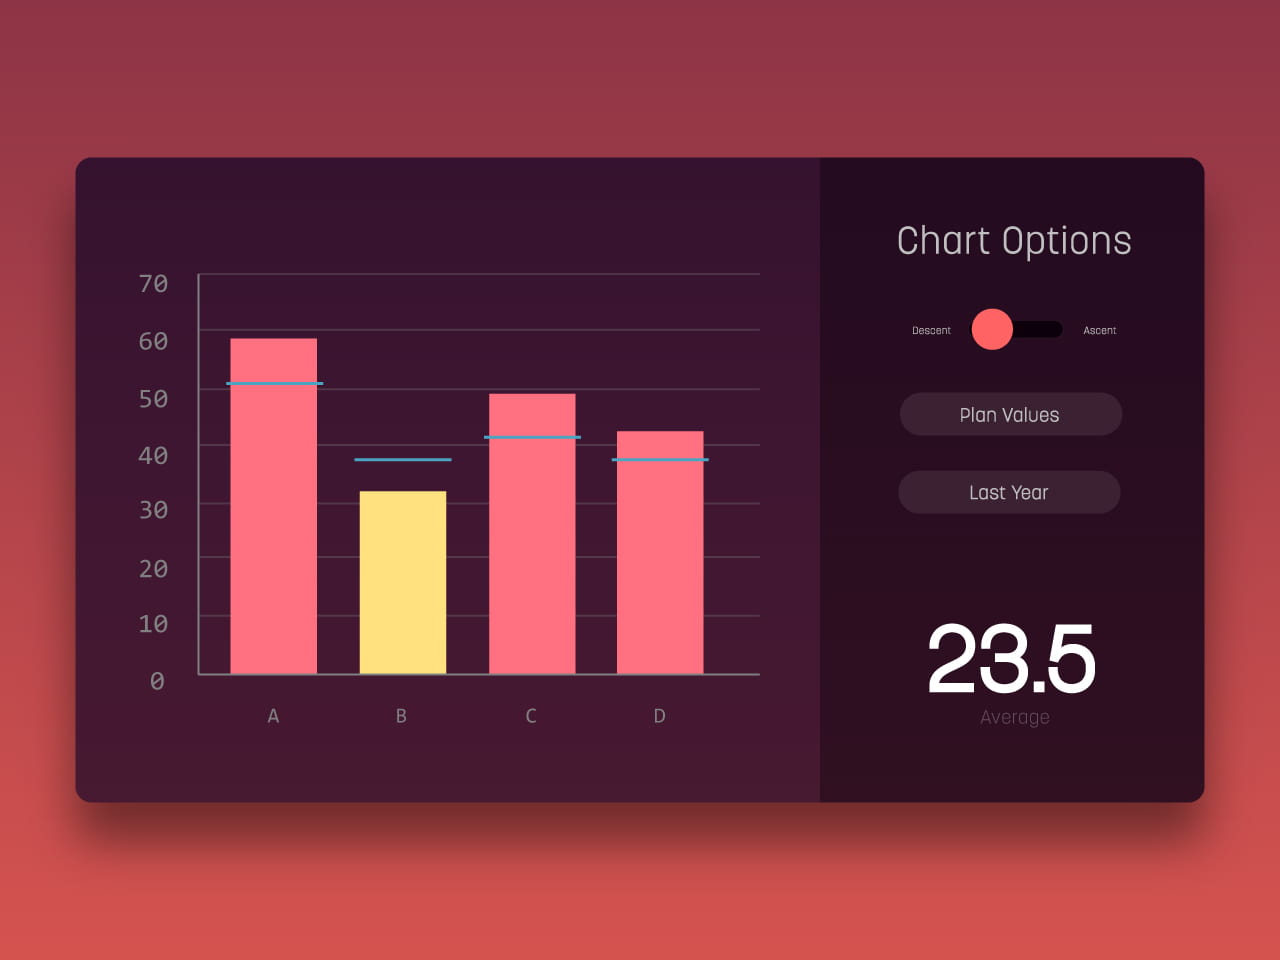


Week 7 and 8 has introduced me into graphical data charts and has allowed me to explore a variety of different ways to visually display data. While doing this task has shown me how data can be displayed, I’ve also learned how strokes, drop shadows, gradients, etc can be added to transform a once basic visual into a more sophisticated and professional visual. These exercises have not only helped me with displaying data in a professional and clean manner but also have allowed me to discover new tools on illustrator to create such charts. I find these tasks helpful in advancing my skillset and keeping the brain going.