BRAINSTORMING WAYS IN WHICH INFORMATION COULD FLOW:
I started off by brainstorming how I could lay out an infographics page. After creating an infographics Pinterest board I started paying attention to how information flowed in each page, and how there was usually an overall plan to how it would look before the topics are even decided.

BRAINSTORMING WHICH SUBJECT AREAS IM PASSIONATE ABOUT/ NEED MORE COVERAGE/ TRANSPARENCY IN THE WORLD:
Next I mind mapped both areas that I felt needed a lot more transparency and coverage of information, as well as imagery I was particularly drawn to:

RESEARCH INTO FINANCIAL INEQUALITY:
As I mind mapped my interests and statistics that stood out to me I noticed that everything always came back to inequality – and more specifically inequality of wealth. As a result I began to research this in even more depth.
FAST FASHION -I started researching and coming up with ideas on statistics to do with garment workers and the effects that fast fashion is having on our world. I came up with questions like
- how many people buy fast fashion
- how many are subject to conditions?
- how many are underpaid?
- how much are they paid? ->put this into perspective in food or shelter or our currency
FINANCIAL INEQUALITY – This lead me onto looking at specifically world wealth – many of the people in charge of fast fashion brands are billionaires with a lot of power in the world, and the further I dug I couldn’t believe the wealth statistics I was coming up with. I came up with questions such as
- who benefits – countries, description, how, percentage
- who suffers – countries, percentage, how, pay, hunger, disease, overworking/ hours work


A CHANGE IN DIRECTION
After researching this area a bit however, I decided to look at a completely different topic to what I had in mind before. I felt it would be interesting to research how our generation (21st century onwards) was different to no other in that we grew up in a world with computers and the answer to all of our questions at the touch of a button. As a result I began mindmapping and brainstorming potential statistics I could include.
WHAT DO PEOPLE WANT TO KNOW ABOUT THIS SUBJECT?:
I did one mind map with this question in mind – id like to do an infographic that answers questions people may have, so brainstorming what those questions may be is useful. I also created another infographic based on specifically what popped into my head when I thought of how technology and people interact with each other.


RESEARCHING STATS:
After doing this I started researching statistics to try and gain more knowledge on the issues within this topic.


SKETCHING OUT POTENTIAL IMAGERY:

ESTABLISHING A NARRATIVE:
I knew that I wanted my infographic to have a structure and for information to flow seamlessly together. Because of this I decided to have a kind of narrative to it – I started off by introducing the Information Age and what it is – then started into the history of internet usage and sales on different internet products. I’ll then do a breakdown of which products these are, who has access to them, how many has access, and ill then go into the negatives of the internet and the effects it’s having on global population.

ADDING IMAGERY:

WIREFRAMING MY INFOGRAPHIC:
I wanted to make my infographic flow with cables through different sections of information – allowing it to all be tied in together in a subtle way.

DECIDING ON COLOUR:
I decided to go for a maximum of 4 colours so as not to overload the user with too much information at once. I

learned this as I looked at Nicholas Feltron work as his way of using colour was very minimalist yet effective as a result. I chose navy as my shade as I thought black would be a bit too dark considering the brightness of the other colours involved.
MAKING THE WINDOWS SECTION FAIR AND THE NUMBERS REPRESENTED ACCURATELY:
I spent a lot of time trying to work out how to get all the length and width ratios to be the same throughout the windows representing number of users. I laid out all the numbers involved and worked out the areas of the rectangles needed as a result.


As a result I was then able to have rectangles of equal ratio of various sizes representing the number of users per social media site.

RESEARCH INTO SUSAN KARE’S 8 BIT PIXEL ICONOGRAPHY FOR APPLE:
As my infographic is all about the history of technology and how its affected us, I felt that incorporating a retro style of pixeled user interface would be quite fitting. After designing my pixel icons Paul pointed out how I had the potential to take inspiration from Susan Kare – the iconographer to design the icons for apples first screen interface.
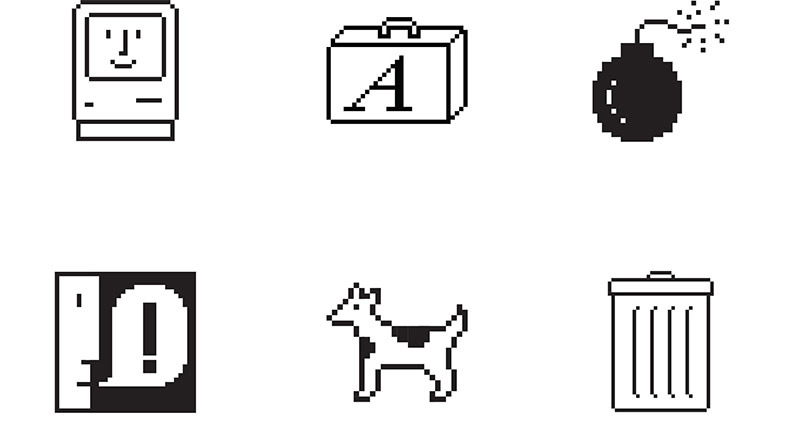
HER PROCESS:
Kare used graph paper in order to keep each pixel in line and the correct sizing.


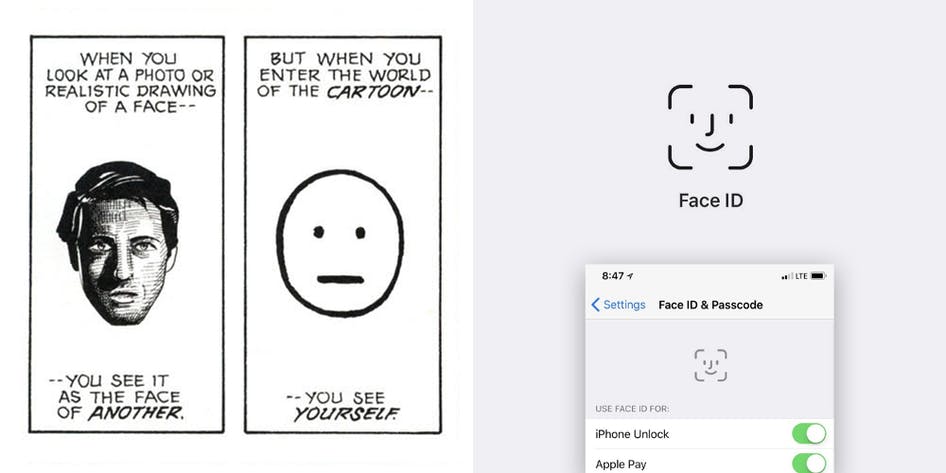
something that I found really interesting was a quote that she said about limiting detail in iconography-
“When something’s really realistic, it looks like somebody in particular who’s not you. When you take all the detail away, everyone can project themselves on to something simple. The fewer details, the more universal something is. That was actually an asset of having to work within 32×32 pixels and monochrome.”
This means that sometimes, the lack of detail will allow for an icon to be used for more purposes, and in the way of faces you even apply simple faces to yourself – rather than with detailed faces you attach another identity to it because the features don’t look like yourself. In other words stripping back things that don’t apply to everybody in icons allows them to resonate with more people.
Another point was that stripping back the details for a lot of things allowed them to be used for longer – as it meant they were less likely to become outdated looking.-
“The printer on the left obviously looks outdated. But if you start taking away the holes for the sprockets in the paper, and the knob that turned it, there’s just enough detail that it could have had a longer life as a printer icon.”

MY ICONOGRAPHY:
I also designed my icons on a squared piece of paper


DIGITISING THEM: I added a circle around my icons allowing them to blend in a bit better with the rest of the infographic – this was because the rest of it has very rounded edges and more of a softer feel to it.
