To begin this lecture we were asked if we had an idea for a project yet, which I had. We were then asked if our project needs exist.
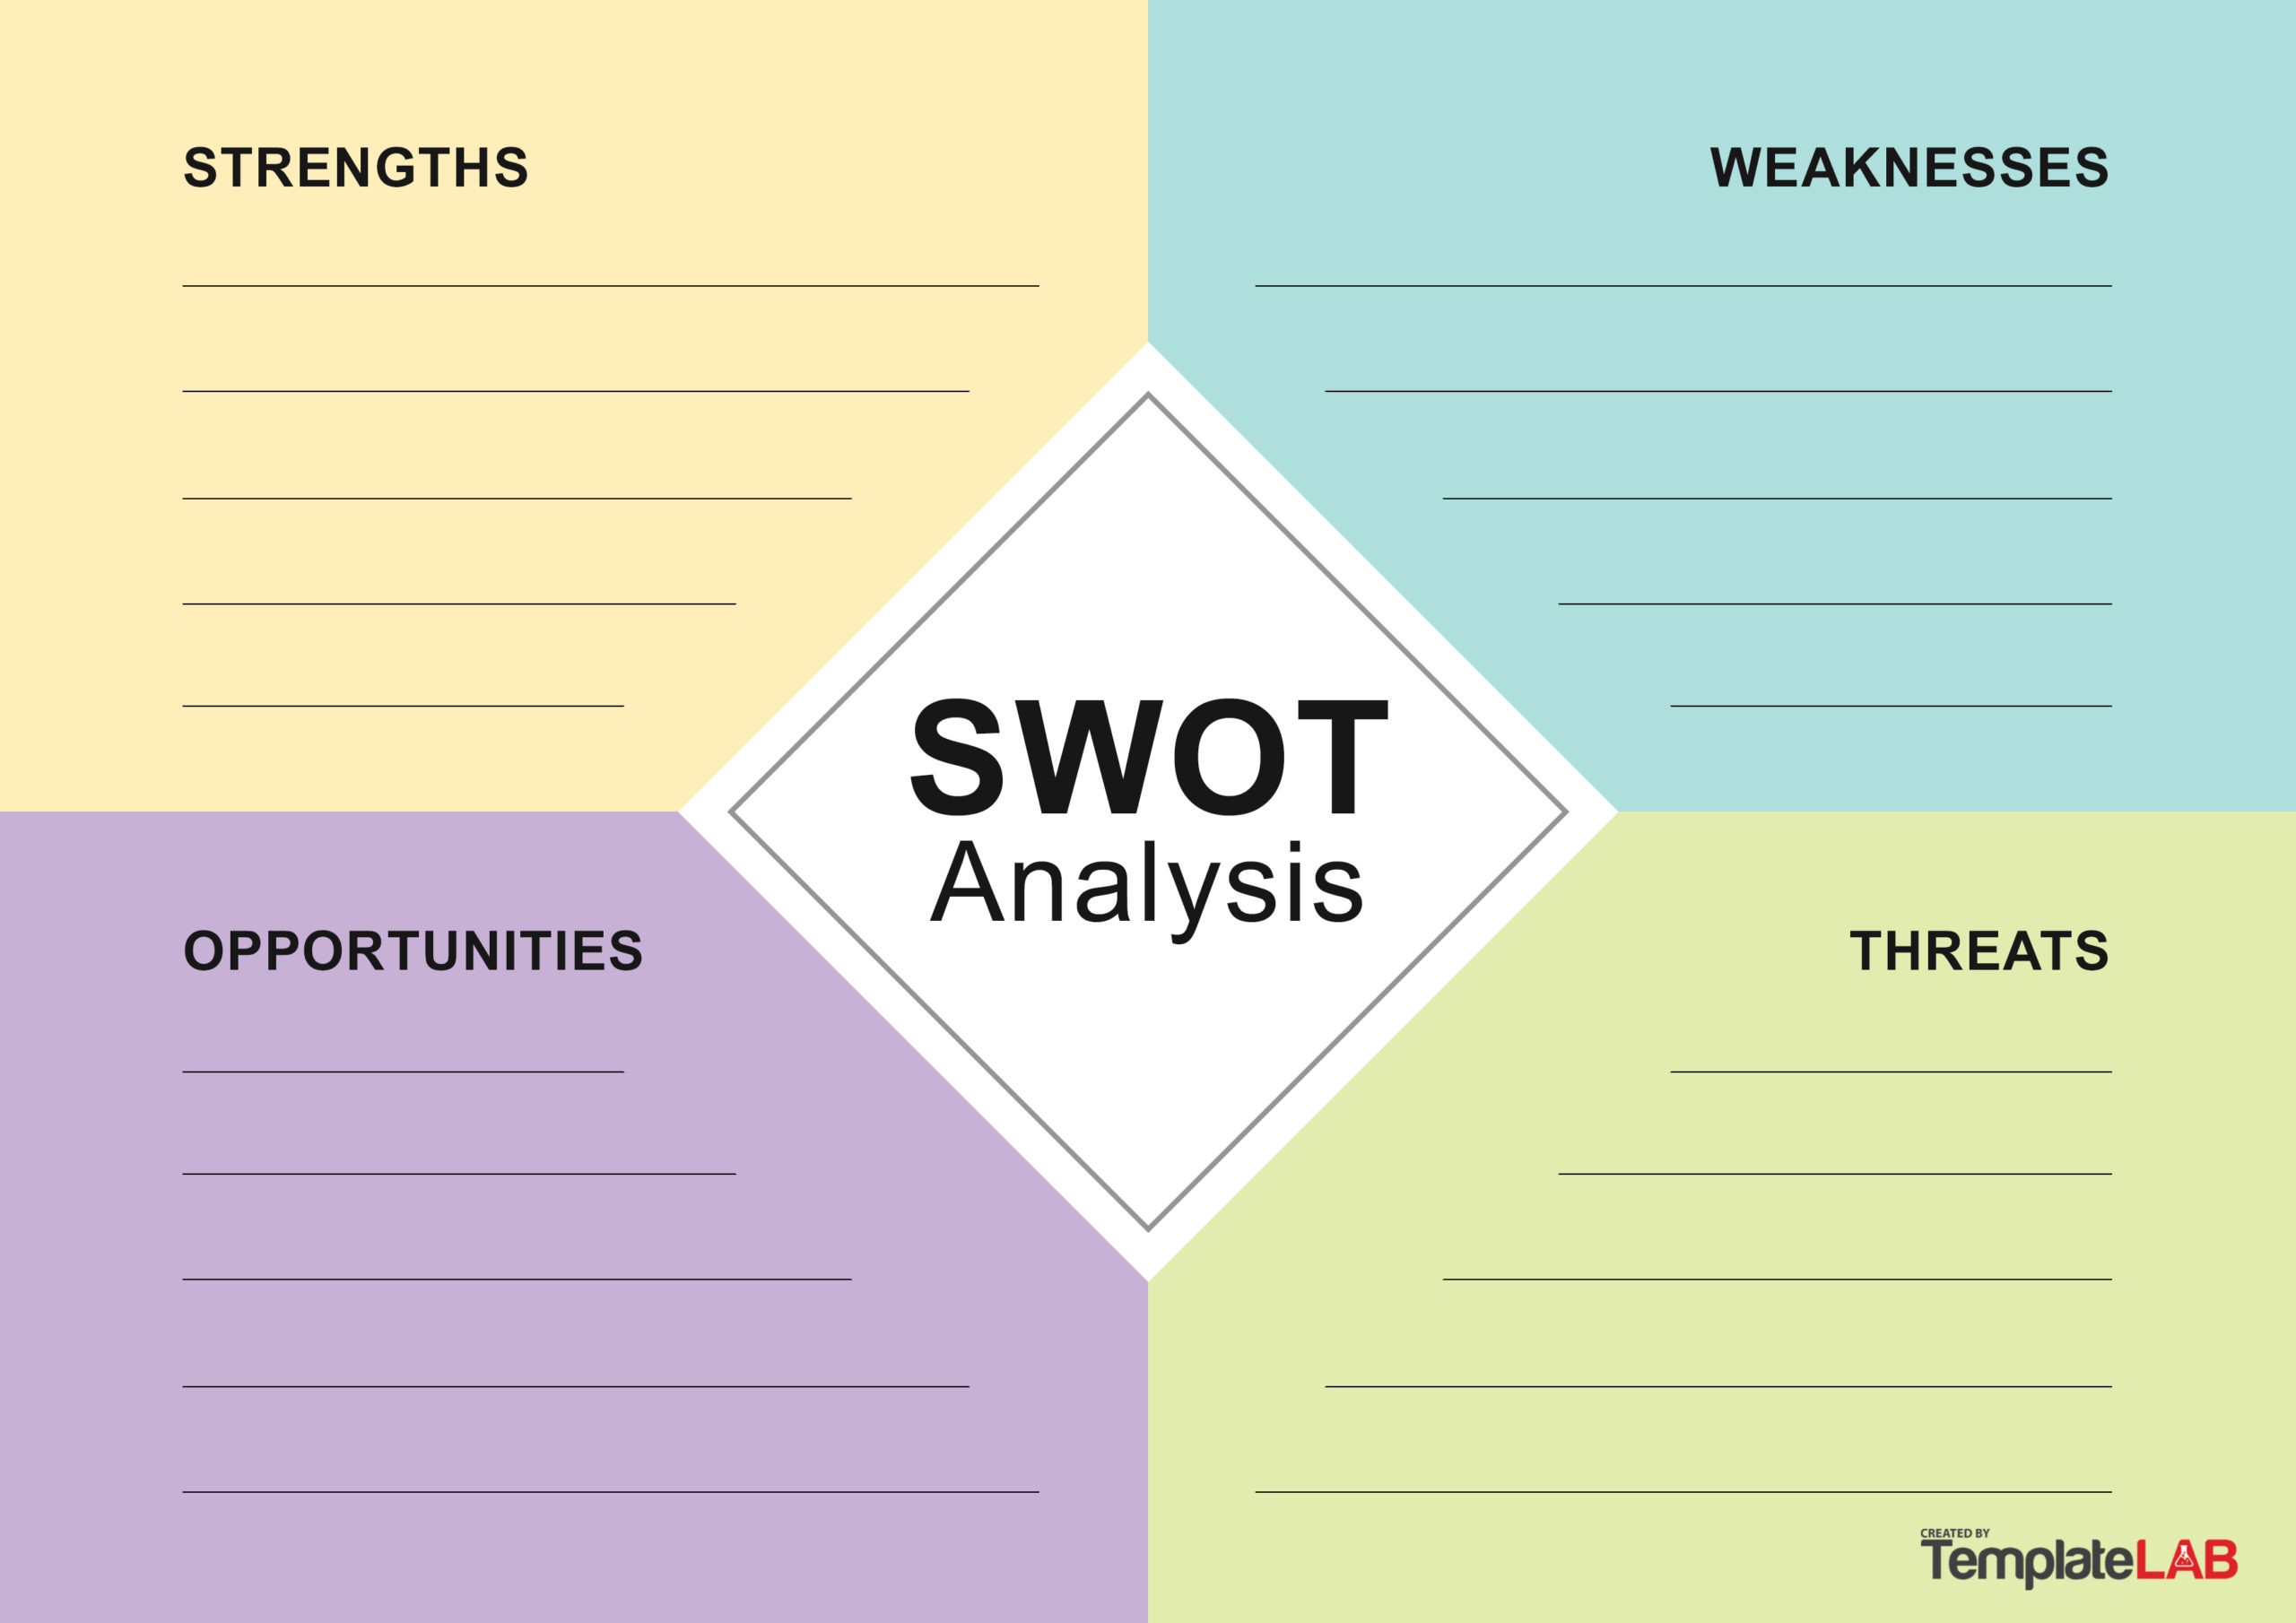
To answer this question we were told to conduct a SWOT analysis. A SWOT analysis would look something like this:
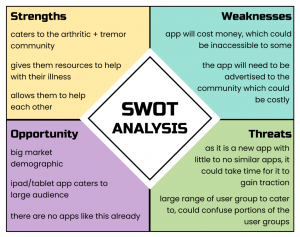
This my completed SWOT analysis:
After we would complete or SWOT analysis we should ask other people if they think it should exist.
This would take the form of our user research and this could consist of user interviews, surveys, competitor reviews or published data. It’s important we do this to understand the user we are designing for.
There are two different types of research, Qualitative and Quantitative.
Qualitative is a subjective, immeasurable and is mostly made from open ended interviews, opinions and insights.
Quantitative is objective, measurable and is made from surveys facts and test theories.
User research can be done at any point in the design process as it always improves the design.
User Research can also come in the form of Competitor Research. Competitor Research can be something as simple as looking through the reviews of a similar app or forum posts about your project topic.
The steps for good User Research
- Define the user groups you are going to be catering to
- Decide on the research technique you will use
- Conduct your research
- Analyse your results
- Generate your user requirements
Bias in research
-
Cognitive Bias- every person has their individual perception of reality
-
Confirmation Bias- tendency to search for info that confirms your values
-
Groupthink- cognitive bias to conform with a group
-
Selection Bias- the data found has no value as participants weren’t equally selected
We can also cause bias, when we self reference in our designs and seek out answers and responses that tailor to our values. We shouldn’t make assumptions about the users want, it should always be tested.
Analysis- can prove credibility and validity, you should try and find patterns between the user research techniques you’ve used.
There are some ways to analysis data such as the KJ Method.
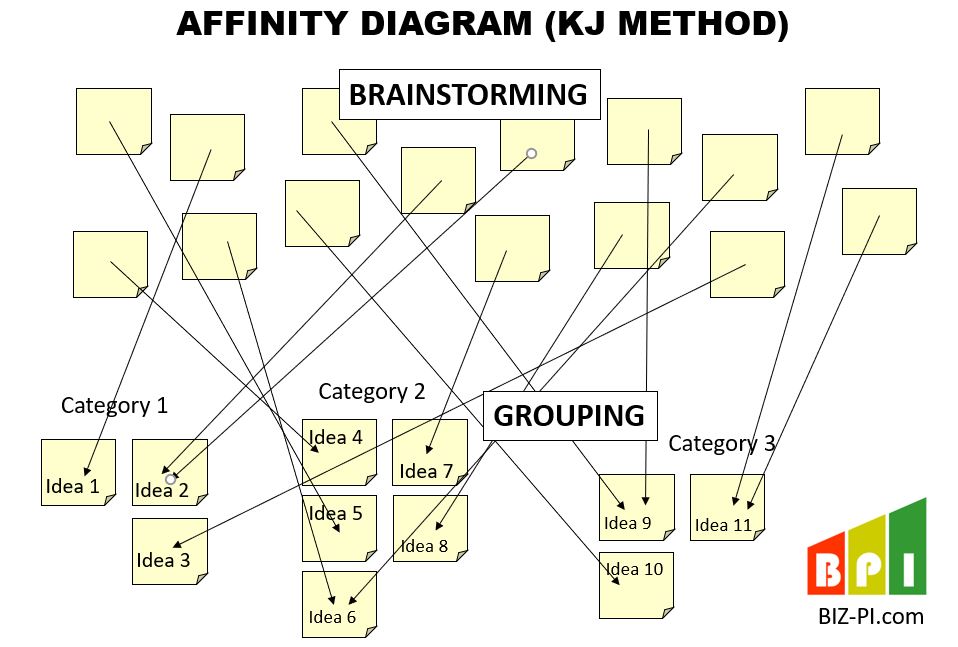
The KJ method involves sorting brainstorming into smaller groups and labelling them.
After you have created your user requirements, you should start prioritising the features of your design. This should be done by separating your features and organising them into a table.
User Personas can be designed after user research is completed and you have grouped your user base. Creating a persona for every group helps you understand and keep in mind their separate goals during the design process. Along with user personas, Empathy maps can be completed.
Presentation update
This week I focussed more on the user and research needed for my presentation.
I started off asking the user group I had most available to me about these issues. My mother and grandmother both have arthritis in their wrists, my cousin was born with arthritis in all parts of her body. I remember from whenever we were children, that handwriting tasks were difficult for her and she would often need teaching assistant help. My boyfriend has an essential tremor which I hadn’t known too much about before I met him. I know sometimes it can cause problems with his handwriting and I wondered why there wasn’t more information to help these problems.
I decided to do a user interview as this was the best form of user research at this time for me.
I asked them these 4 questions:
- Do you have access to an ipad/tablet
- Do you feel anxious before starting a handwriting task?
- Would you like to learn exercises to help with handwriting and the joint health of your wrists.
- Would being able to track your progress motivate you?
The image below is of the results of these interviews: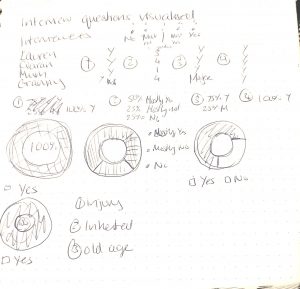
When I am developing the presentation I will digitally draw out these graphs to make them more presentable and understandable.
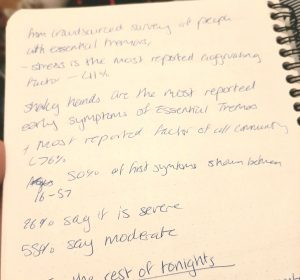
The next form of user research I did was some online research looking through help forms for each illness.
This is what I found:
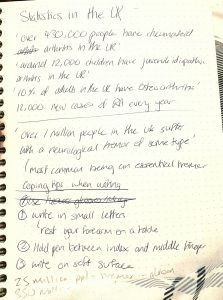
The most interesting statistics I found was that over 430,000 people in the UK only suffer with arthritis and over 1 million suffer with some kind of neurological tremor.
This shows that there is a huge market out there for an app like this and the fact that there isn’t more apps and resources dedicated towards this is a real gap in the market.
Next week
Along with adding more content to my presentation I want to finish all the sketches and drawings I will use in my slides.