Amplifying Data
This week was all about data and how we can use design to display it in the best way. Data is everywhere e.g., data for covid19 and pay scales for minimum wage. It is important for these to be scannable and easy to read and follow for people.
There are many ways to display data including, pie charts, bar charts, tables, etc. Therefore, it is important to consider which of these works best depending on the context.
Here are some examples of data being displayed in interesting ways:

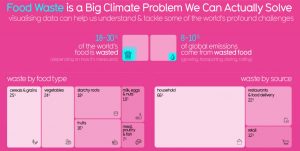


All these data visualization images are by David McCandless. I think he does a great job at making different topics fun to learn about in an engaging way, even some topics people would consider uninteresting.
He can make things easy to scan and understand with just a glance. This means people don’t have to spend a long time reading or trying to figure out what things mean. I think it also makes it easier for people to spot trends within data as you can compare them more easily.
How can I display my data?
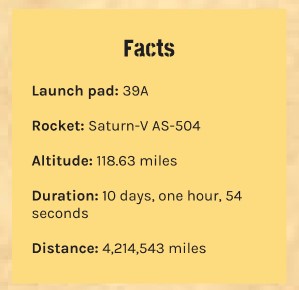
Within my current project on the Apollo Space Program, there is a lot of data. After listening to this lecture, I feel that I could incorporate better data visualization into my project to make it more engaging, interesting, and easier for users to understand.
Currently, in the “read more” section of my prototype, there is a lot of bullet-pointed facts and statistics. Therefore, I want to take one of these and display it in an interesting way.
I want to take the duration of the flights and put it into a bar chart. Depending on which page they are on, that flight will be highlighted. This will allow users to easily compare the duration of each flight to each other.
Here is a sketch of how I want this to look:
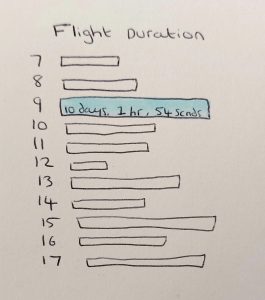
My next step is to design this in Figma and add it to my prototype. I look forward to doing this as I think it will engage users as it is an interesting way to compare the duration of the flights.