What is an infographic?
They are graphic representations of information/data designed to present information quickly and clearly. It improves understanding of content.
Things to keep in mind:
- Have an anchor: This connects the information together and makes it flow better.
- Different approaches: sketch, photography, digital etc.
- Should present information clearly and quickly
- Illustrations should support the story, not distract from it.
- Consider colour and type
- Information should be accurate and well researched
How to visualise data:
Want to inform? Use a donut chart or pictograph
Want to compare? Use bar/pie charts or stacked column charts
Want to show change? Use a timeline or line chart
Pinterest board:
I will refer to this for inspiration when creating my own infographic.
https://www.pinterest.co.uk/lgilmore401/infographics/

Infographic designers
David McCandless
McCandless uses different approaches from graphs, timelines, maps, and typography to pie charts. He makes complex topics much easier to follow and understand. His use of colour and different forms make important things stand out. His infographics help you visualise different concepts and data rather than just having words and numbers.

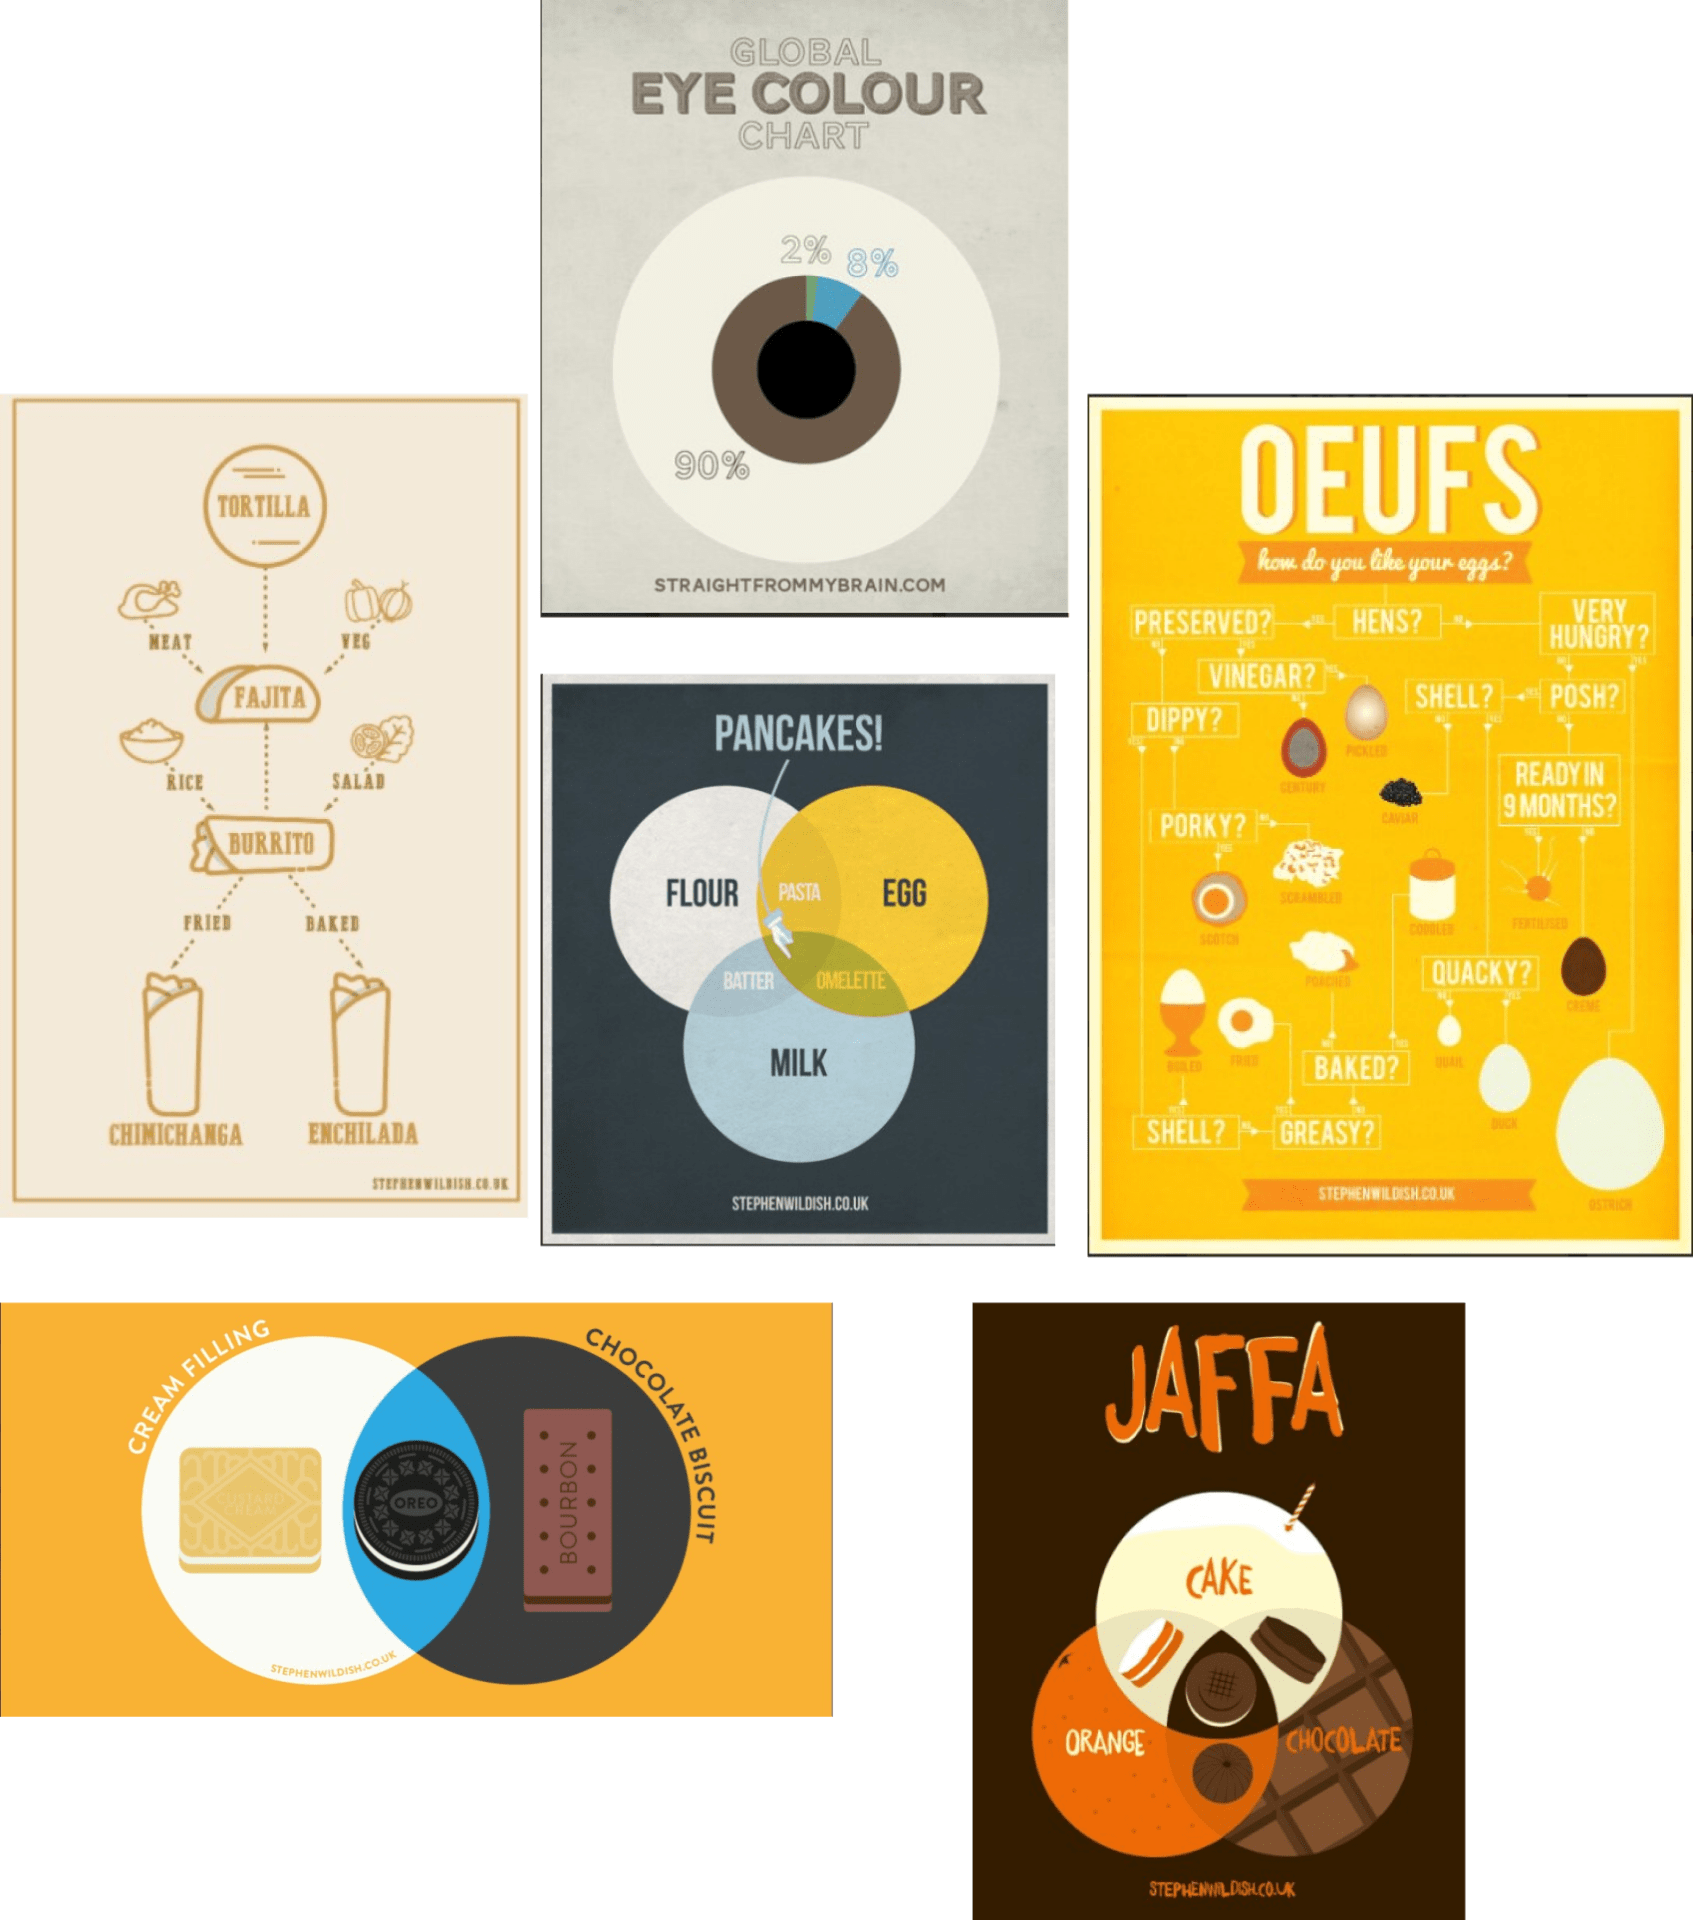
Stephen Wildish
Wildish takes a more illustrative approach, taking a variety of topics and presenting them in a fun way. A lot of them are very simple and minimal. This has given me inspiration for my own as I don’t want it to be overwhelmed with unnecessary details. His work has also inspired me to incorporate illustrations into my own as I feel they are visually appealing and can help tell a story.
99designs, MNoriega
This is some work I found from an infographic designer on 99designs. I really like his illustration style as they’re bright, colourful, and eye-catching. I also like the colour pallet choices as he tends to stick with 3 colours and work with them using different tones.
The layout and illustrations make the information easy to understand. They are very professional and good quality.

Conclusion
After looking at these designers I can see that there are many approaches to creating infographics. I am very inspired by the illustrative approach as I feel it really adds to the story and helps break up information so its easier to read. Illustrations can help create anchors if they flow through the whole infographic, connecting things together. My next steps will be to continue gathering inspiration and continuing my research so I am prepared to create my own infographic.