Before sketching ideas I did a some research on infographics and data visualisation which included looking on Pinterest and creating a board full of inspiration and examples: https://www.pinterest.ie/laurabfoy/infographic-inspo/

I then brain stormed topic ideas.
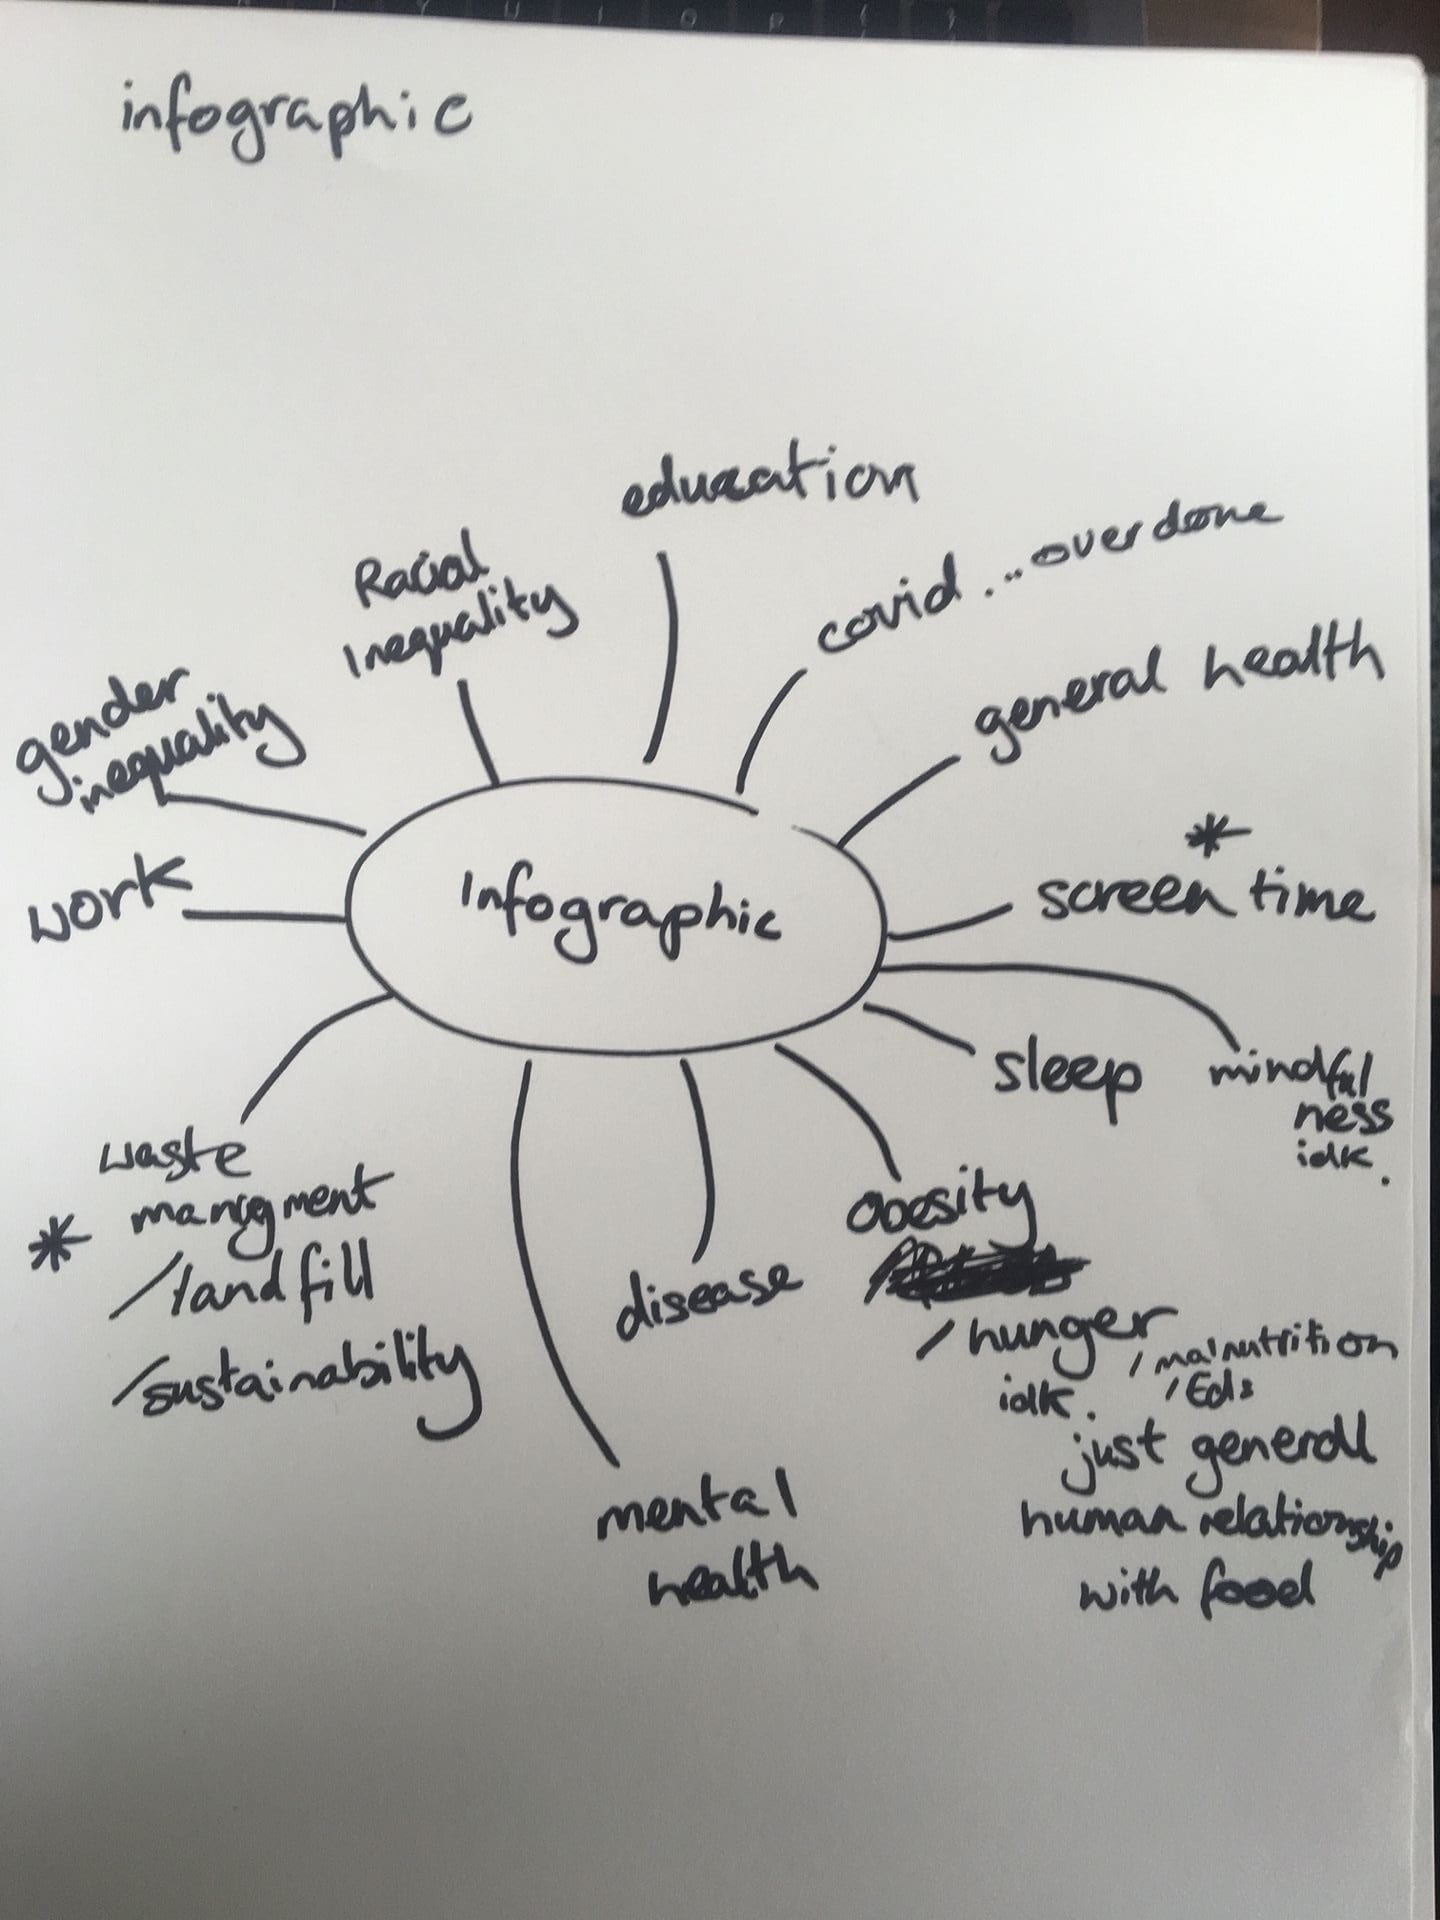
I put a star next to the topics that interested me the most in that I could immediately envision a concept for them. These were screen time and waste/ landfill/sustainability.
Here is my concept for waste/ landfill/ sustainability:
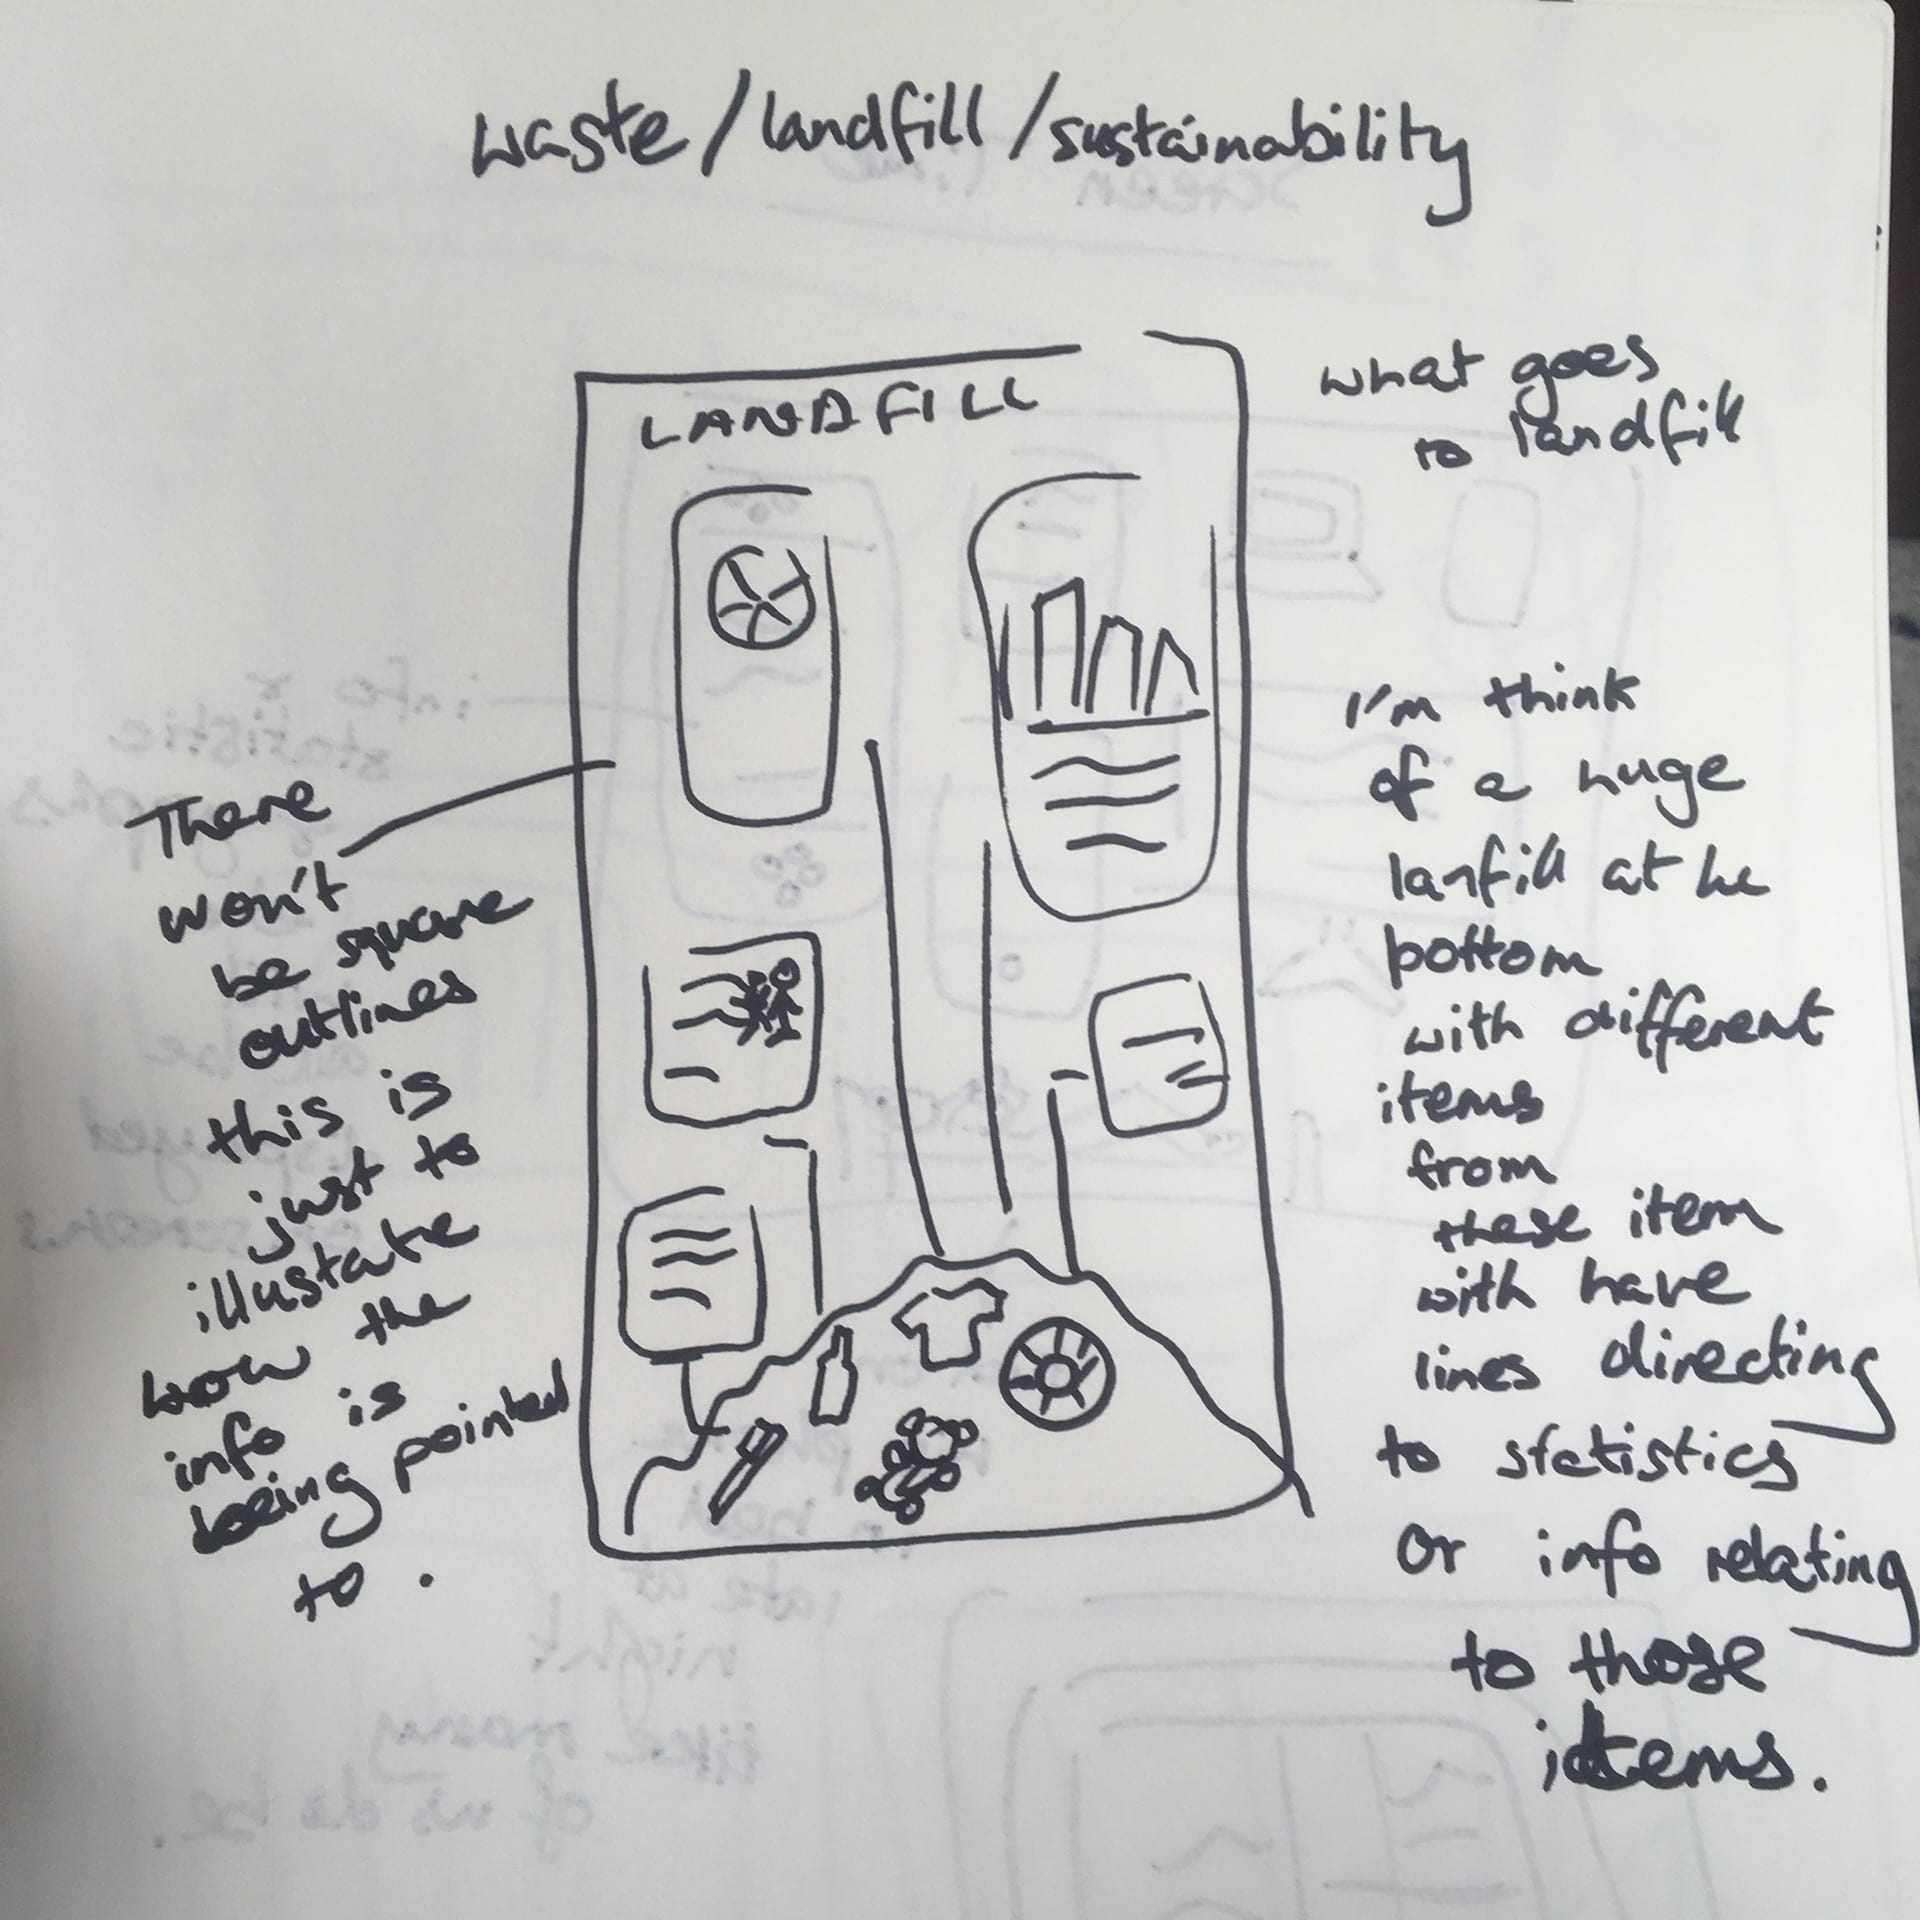
It’s a bit rough but hopefully it gives you an idea. I am very passionate about sustainability and feel as though I constantly correcting people putting the wrong things in the wrong bins. I like to do research into the topic of waste and landfill and so I know a lot about what can end up there but I don’t think a lot of do. Not many people know that even if you put plastic in the recycle, if a company doesn’t buy it up to reuse it then it will just end up in landfill anyway. That’s why it’s better to buy cans as recycled aluminium is highly sought after since it’s cheaper to reuse than reproduce.
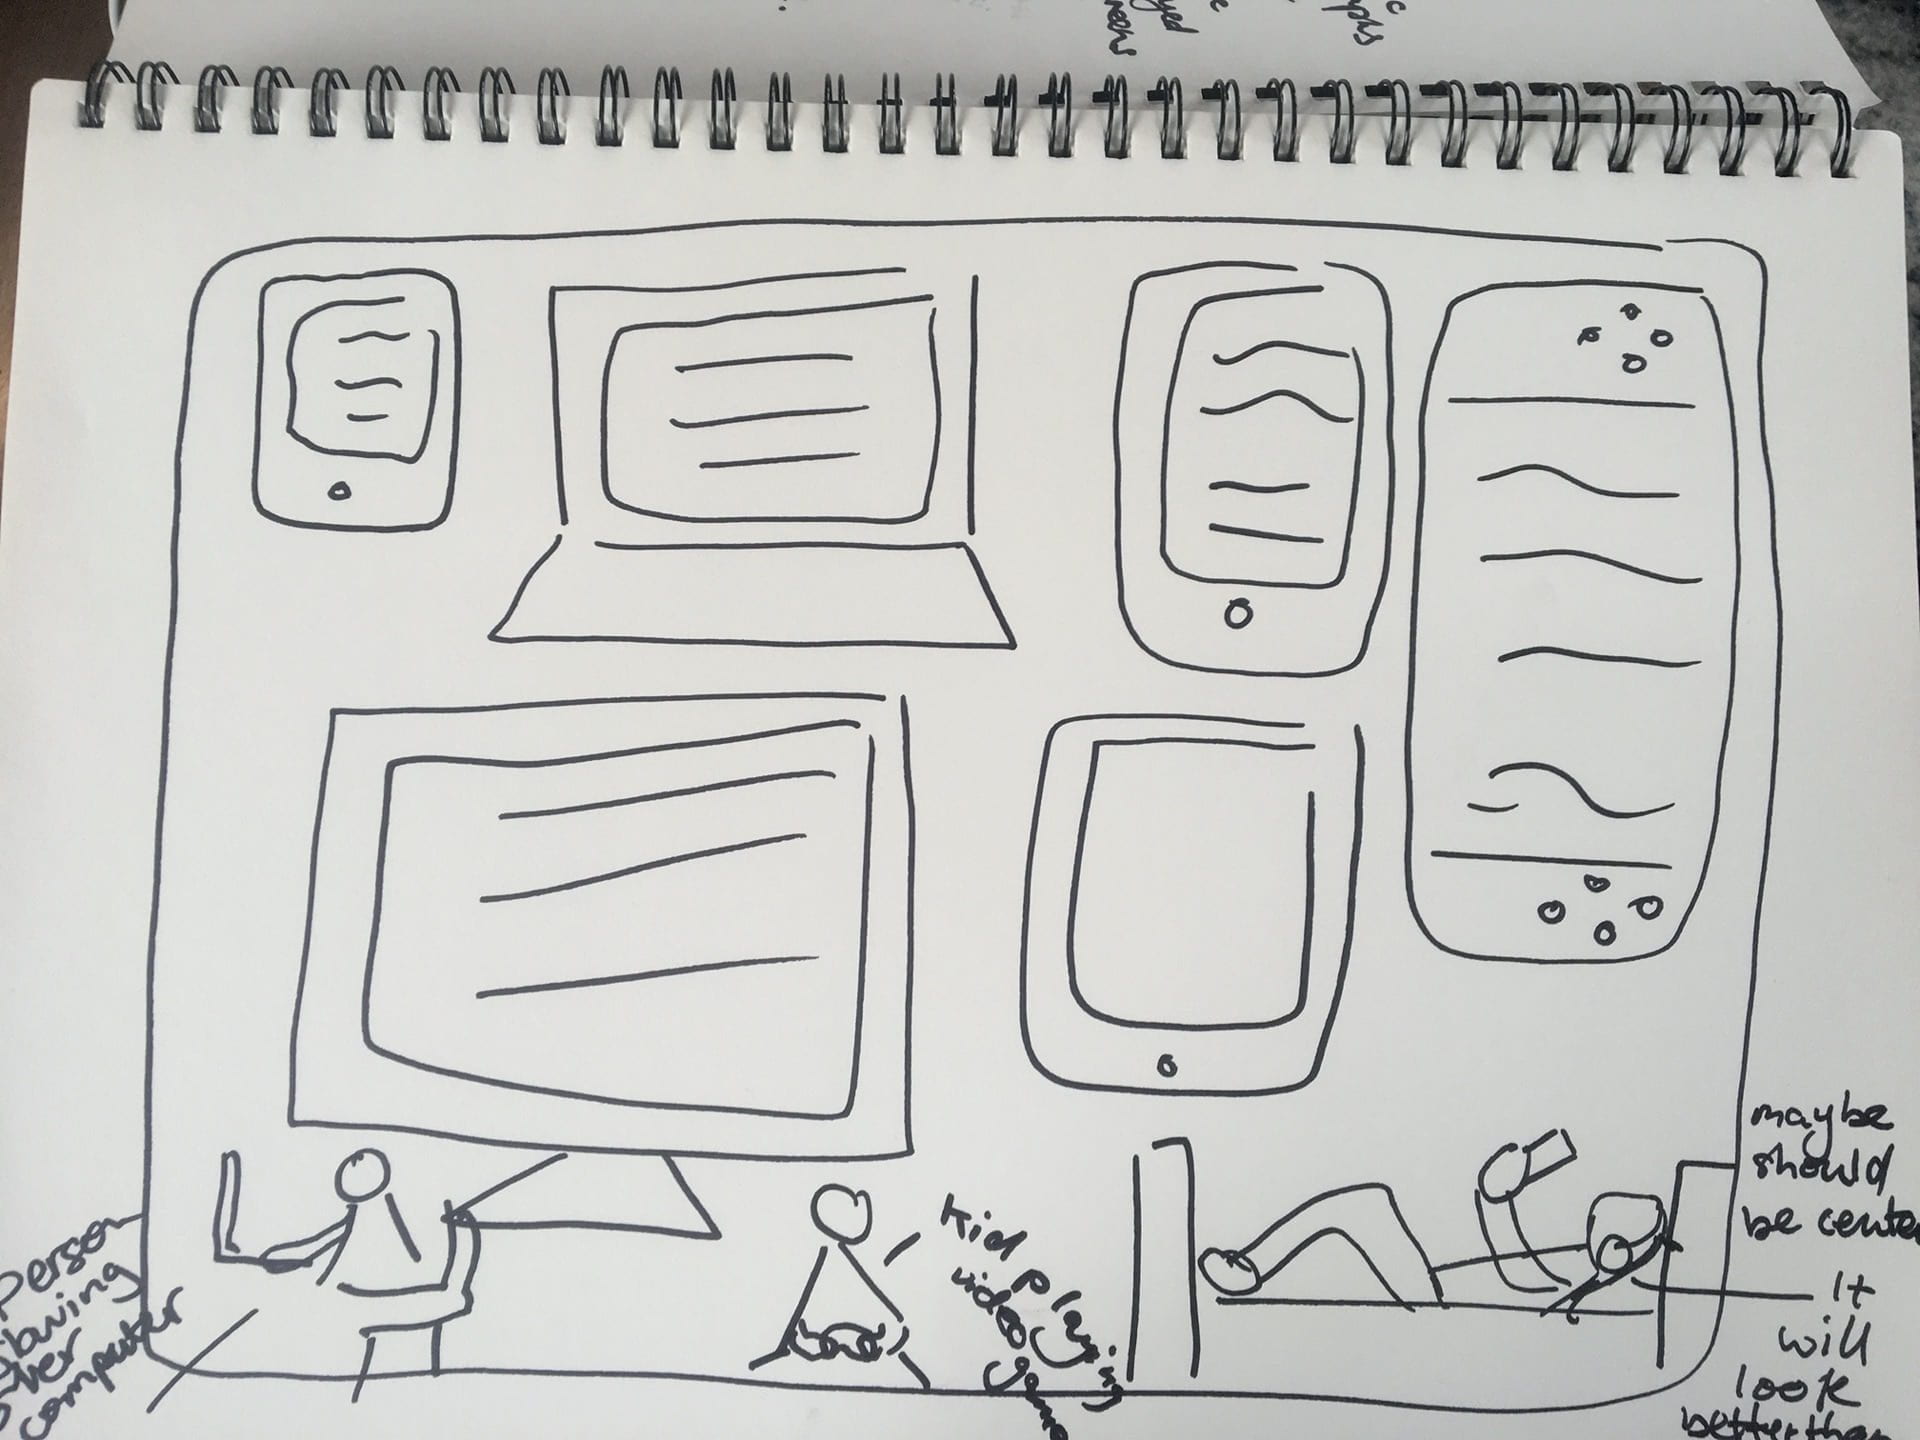
Here is my concept for screen time:
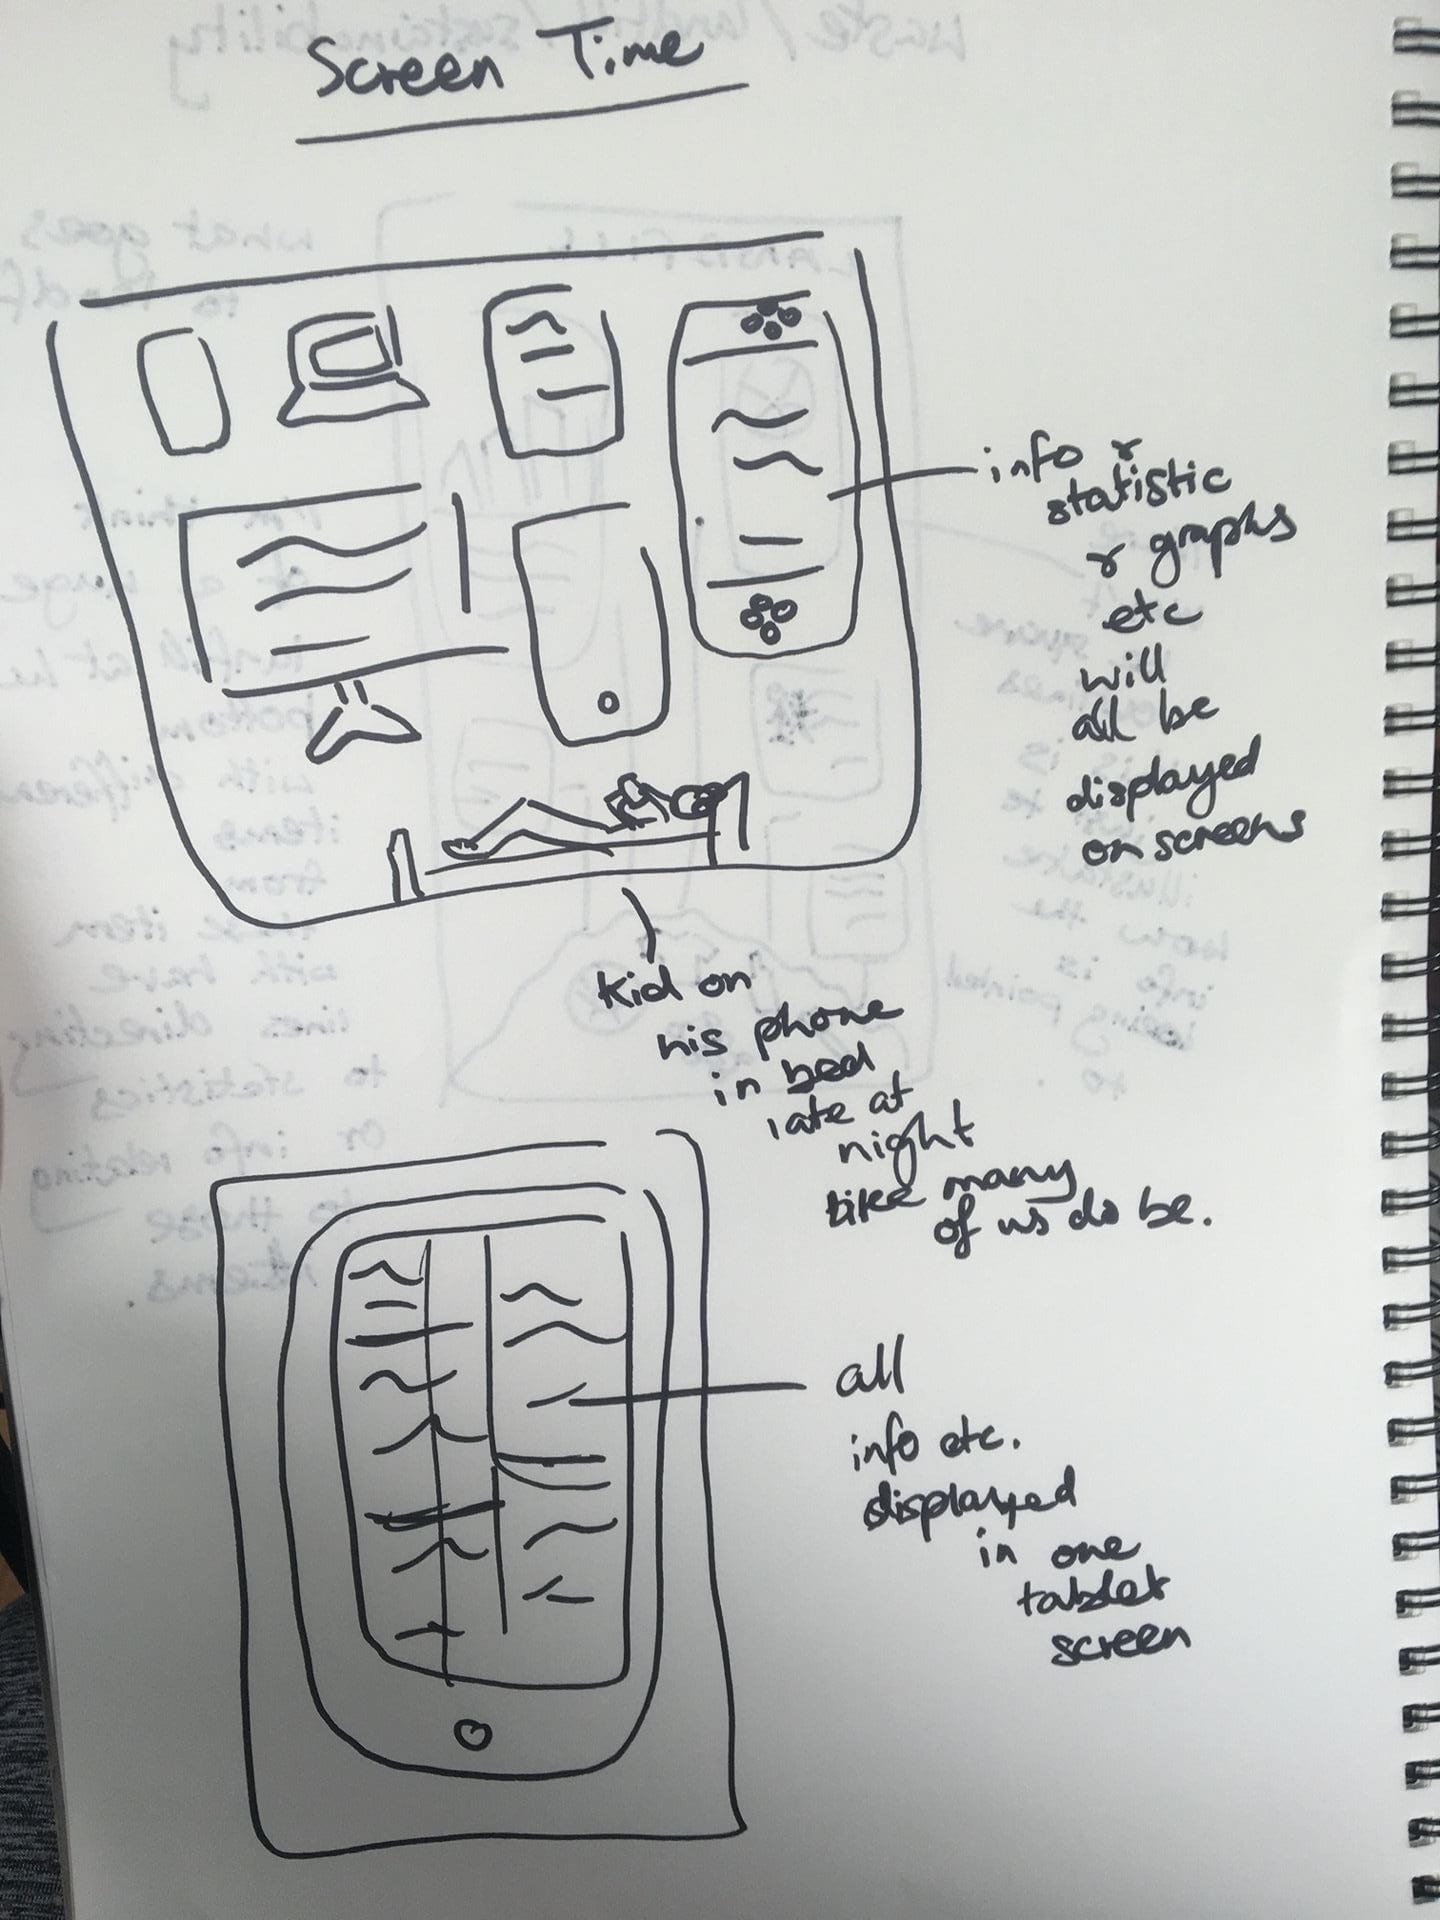
I think the amount of time we spend looking at screens and the impact that has on our overall well being is something that is really relevant at the moment especially in these times when most things are online so I thought it would be a good idea to do an infographic on this especially in relation to kids and teens and people who’s 9 to 5 is working at a computer.
I think I’m going to go with screen time since it’s relevant to the pandemic in a way and I feel like there are loads of environmental infographics about recycling and sustainability out there already. I also like the idea of putting my graphs and statistics in device screens.