
This week our lecture was on “Designing infographics”. He first talked about the use of Pinterest for collecting Images and add them to your Blog. He created a board on infographics which he showed us as Inspiration. These images are good for referencing. These will help us when considering our own designs. Paul explained that the designs should be kept simple and does not have to be overly complicated. It can be hand drawn or digital. He said if we wanted, we could look at his Pinterest for more examples. Below is a screenshot of Paul’s Pinterest: eleventhirty. He stated the importance for us to build up our own Pinterest boards as they are good for inspiration.
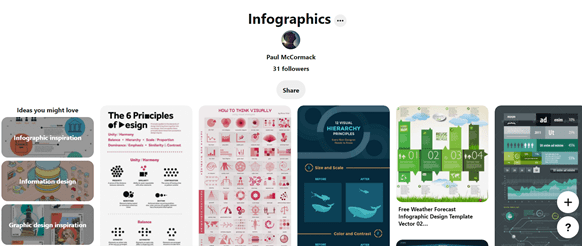
He stated the importance for us to build up our own Pinterest boards as they are good for inspiration.
He then went through the slides. He mentioned a couple of books which may be useful for referencing as they are all on Infographics. Below are the names of the books and authors along with an image following:
McCandless, David. Knowledge is Beautiful
McCandless. David Information is Beautiful

Ritchie, Josh, Crooks, Ross, Lankow, Jason. “The Power of Visual Storytelling Infographics.
He noted a list of deliverables which he expects us to be working on. Our travel App tasks which include master apprentice exercises, app a minimal 6 screens and designing our Icons. The Infographic tasks include the master apprentices along with the pie chart and bar chart and researching our blogs.
This week we learned the importance of words which make up a picture. Nowadays people rather images than words. He spoke about the use of Instagram and twitter. Communication can be used through images. A picture is worth 1000 words. Edward Tufte once quoted that “Infographics help fill the gap between words and pictures”. Infographics are a combination of picture and words.

We looked at The rise of information graphics. Infographics are defined as a “representations of information, data or knowledge designed to present information quickly clearly”. Use of Infographics have become more popular in recent times in everyday life as it presents info clearly. We were shown different examples of Infographics. Infographics are a potent form of communication. It gives users a better understanding. We looked at Infographics used to represent information for Air Bnb, Get invited, US elections, Poverty, and data stories.
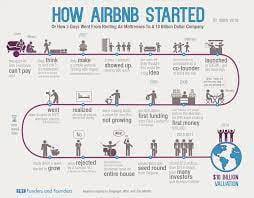
This is an image of a Timeline on how Air bnb started.
Paul said there could be some possible job opportunities in Infographics.
“Infographics are generally created for the purpose of telling or explaining a specific story and will usually be intended for a specific audience thus infographics are subjective” Jack Hagley
He then went on to talk about what makes a good infographic. Mainly the infographic must make sense and be information. We mentioned the Utility of infographics. We were looked at different steps which we should consider when designing our own infographics. It’s important to research and sketch out before designing the infographic.
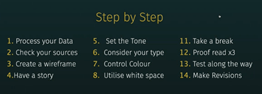
He went through these steps and shows many examples. He listed a couple of resources on blackboard.
This week we were asked to research content on infographics and reproduce 2 bar charts as accurate as possible for are master apprentice exercises.