Primary Research
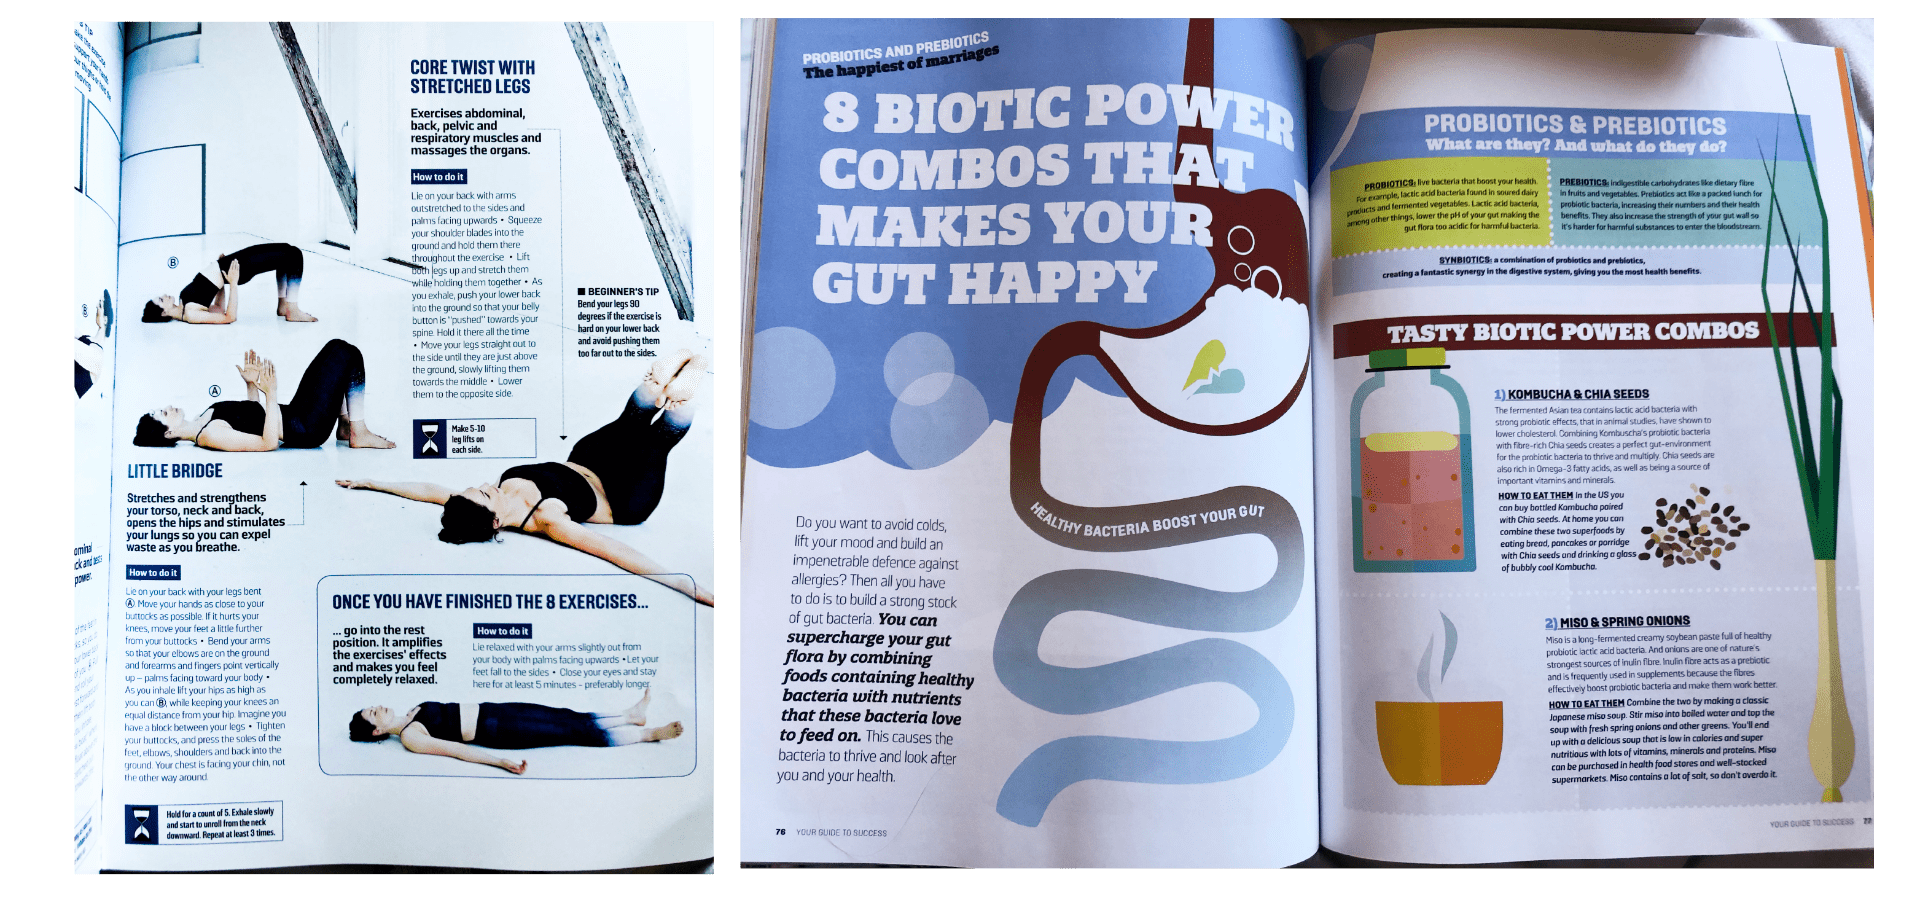
I began my research by looking at a number of primary resources to find some initial inspiration and different ways information could be presented. Above our images take from a health magazine. I like how in the above-left outcome the text is broken into sections and images are scattered throughout each corresponding to the relevant steps. I also like the use of boxes to section off information and icons as an additional reinforcement of the text that is being presented.
To the right is a more illustrative outcome with colours and boxes breaking up sections and illustrations guiding the reader through the information. The information presented in the is example is closer to an article than an infographic however I like the inclusion of a bold title, vibrant colours and the illustrations scattered throughout.

The above are images taken of graphs and data visuals found in a medical journal. The first chart shown to the left presents information in a column rage outcome with colours corresponding to the key displaying the methodological quality of individual participant data. I find the visual here to very helpful in making the information more accessible and easy to take in at a glance.
The second infographic presented above, details information on the use of ivermectin (a drug from Japan) against usual supportive care. Here another column rage chart is included however in this outcome a lot more information is included making the chart slightly more difficult to read and definitely require more focus and attention. However, the colour coding is helpful and a star rating is included which is more accessible. Interestingly a link is also provided to an online interactive infographic displaying the same data in more detail (I have included this below).
The final outcome (above right) presents the data flow through NHS Digital of CVD-Covid-UK deidentified linked dataset. I was originally drawn to this outcome due to the use of pictograms however I struggled to understand how the pictograms fit with the rest of the flowchart. The pictogram appears to relate to secure access to deidentified data and aggregate outputs however I can’t seem to relate the number of pictures to specific quantifiable data. This is likely because I am unfamiliar with the complex data being presented however in my own infographic I need to make sure that my data is readily accessible to my target audience to ensure that what I am presenting is easy to understand and readily accessible.

To view the full infographic click here and log in.
The overall outcome of the above interactive infographic is much more inviting with its clear sections and bold colours. It includes more information on several other drugs beyond ivermectin and presents a clear summary of recommended use and colour codes for each drug. Findings similar to those included in the journal outcome are then presented in dropdowns however more spaced out making them clearer to read and understand. This really highlights the importance of clear space and making information accessible, it is also interesting to consider how data visualization can correspond across various mediums.

The above charts a taken from a psychology textbook, Psychology by Palgrave Macmillan. A couple of the charts that jumped out to me were a pictogram and a colour-coded bar chart. I found the pictogram a little difficult to read however the visual really drew me in and made me want to take the time to understand what was being presented. If using a pictogram for me a point I have taken from the above examples is to make sure that the pictures are significantly different from one another. As in the above-left example, a couple of the images are difficult to distinguish between. The bar chart I found much easier to real and I like how additional information was tied to the bar chart through clear colour coding.
Project Specific Research
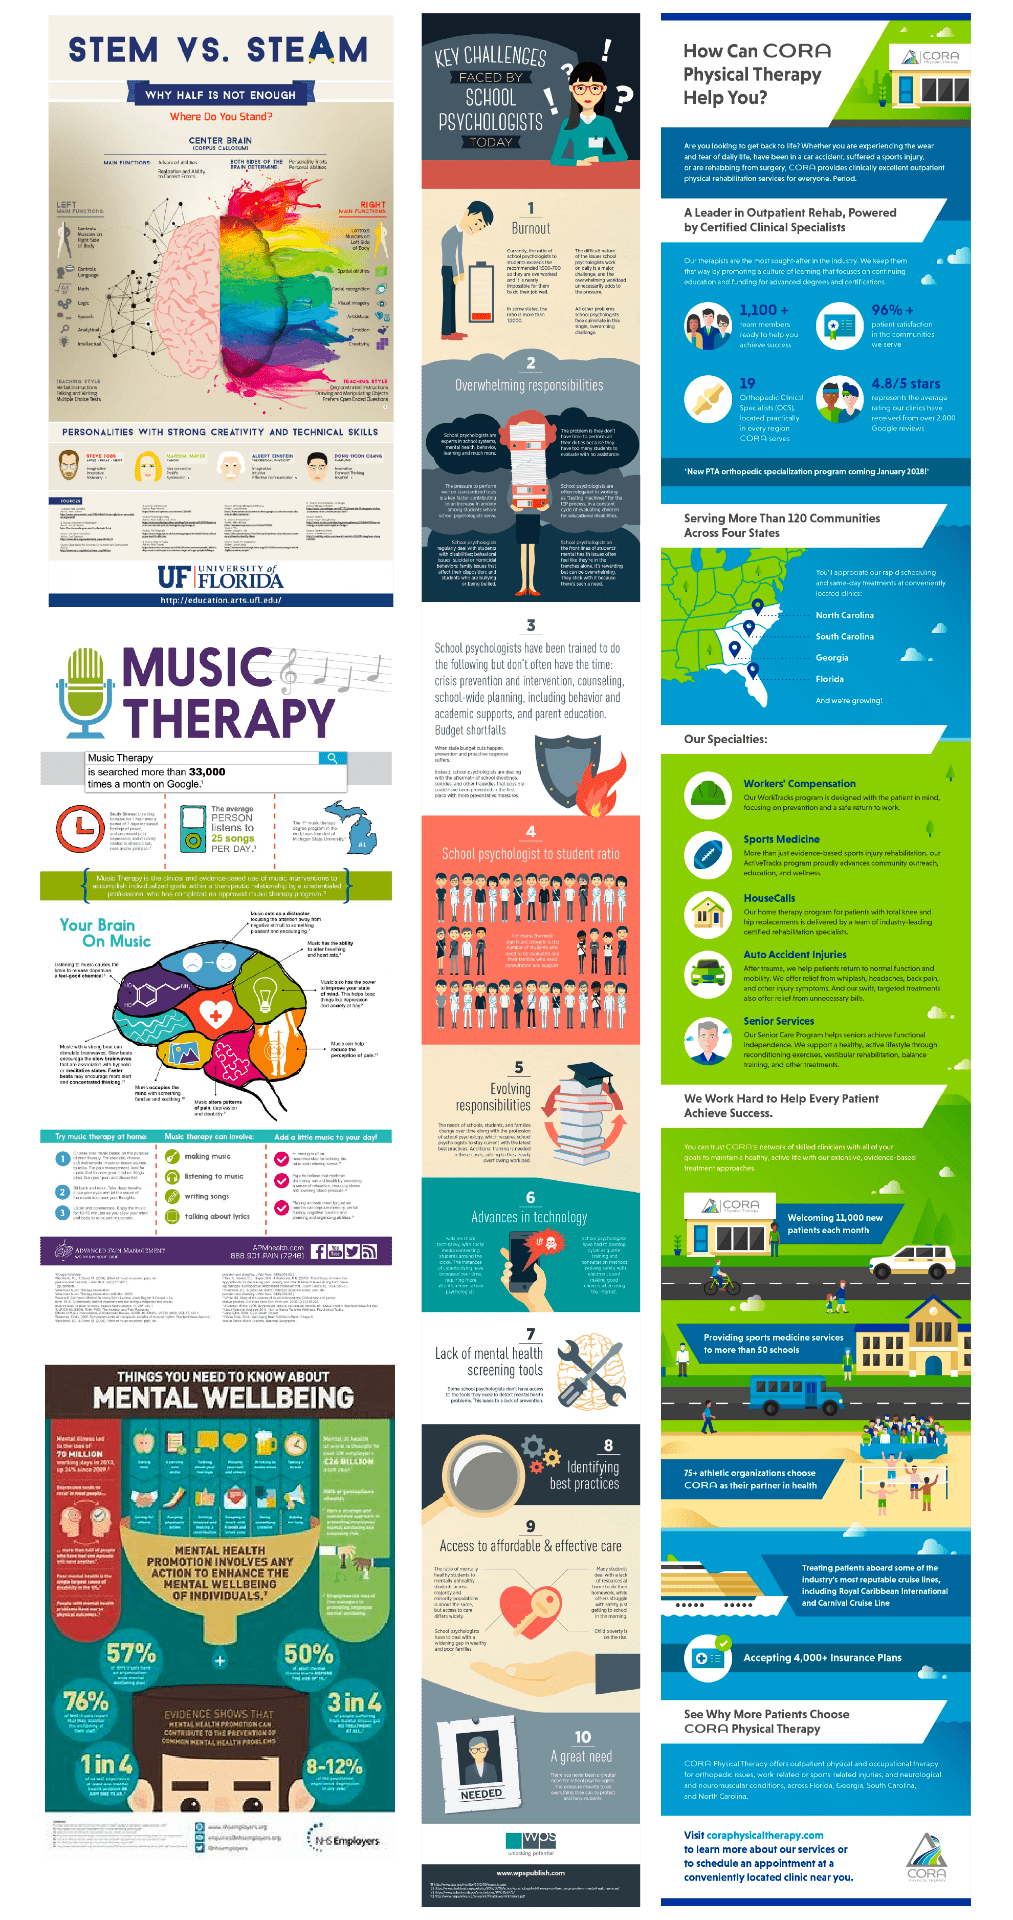
Above are a number of mental health, therapy and psychology-related diagrams I found on multiple sources including psychology today and therapy today. I wanted to get an idea of how other infographics had present similar content to what I will be presenting and found the above examples to be the outcomes that were the most helpful.
I love the bright colours used in the above examples as well as the use of clear sectioning, strong illustrations and interesting illustrated/ diagram outcomes. I also really like the incorporation of bold figures, maps and numbers to guide the viewer through the information.
Further to the above examples, I have also created a Pinterest board with examples of interesting data visualizations and infographics.
Florence Nightingale
Before studying data visualisation I was aware of Florence Nightingale’s role as founder of modern nursing however I had no idea about the way in which she recorded and presented data and that she is also described as a pioneer of data visualisation.
Following years of nursing and administrative experience and through her fight to present her findings that administration saves more hospital patients than the best medical science (e.g. germ control) Nightingale is said to have become obsessed with data quality and standardization.
Nightingale was admitted to the Royal Statistical Society and American Statistical Association, with the US Army consulting her about caring for Civil War casualties in 1861.
It’s incredibly interesting to fully understand the story about statistics and the level of reform they can achieve.

In the above outcome, Nightingales most famous data visualisation in which uses to rose diagrams to present the number of soldier deaths due to preventable diseases (blue), deaths due to wounds (red) and all other causes (black). The easy-to-understand comparisons presented above helped to build arguments for sanitary improvements for hospitals.
I find the above diagram to be a striking piece of work and incredibly moving when you consider the reform it provoked and lives saved. This once again highlights to me the importance of the narrative behind the data and how this is considered in the data’s presentation. I would love to be able to present data comparisons as strongly as Nightingale has done in the above outcome in my own infographic.
James Round
James Round is an independent graphic designer and illustrator that creates compelling data visualisations and bold illustrations.
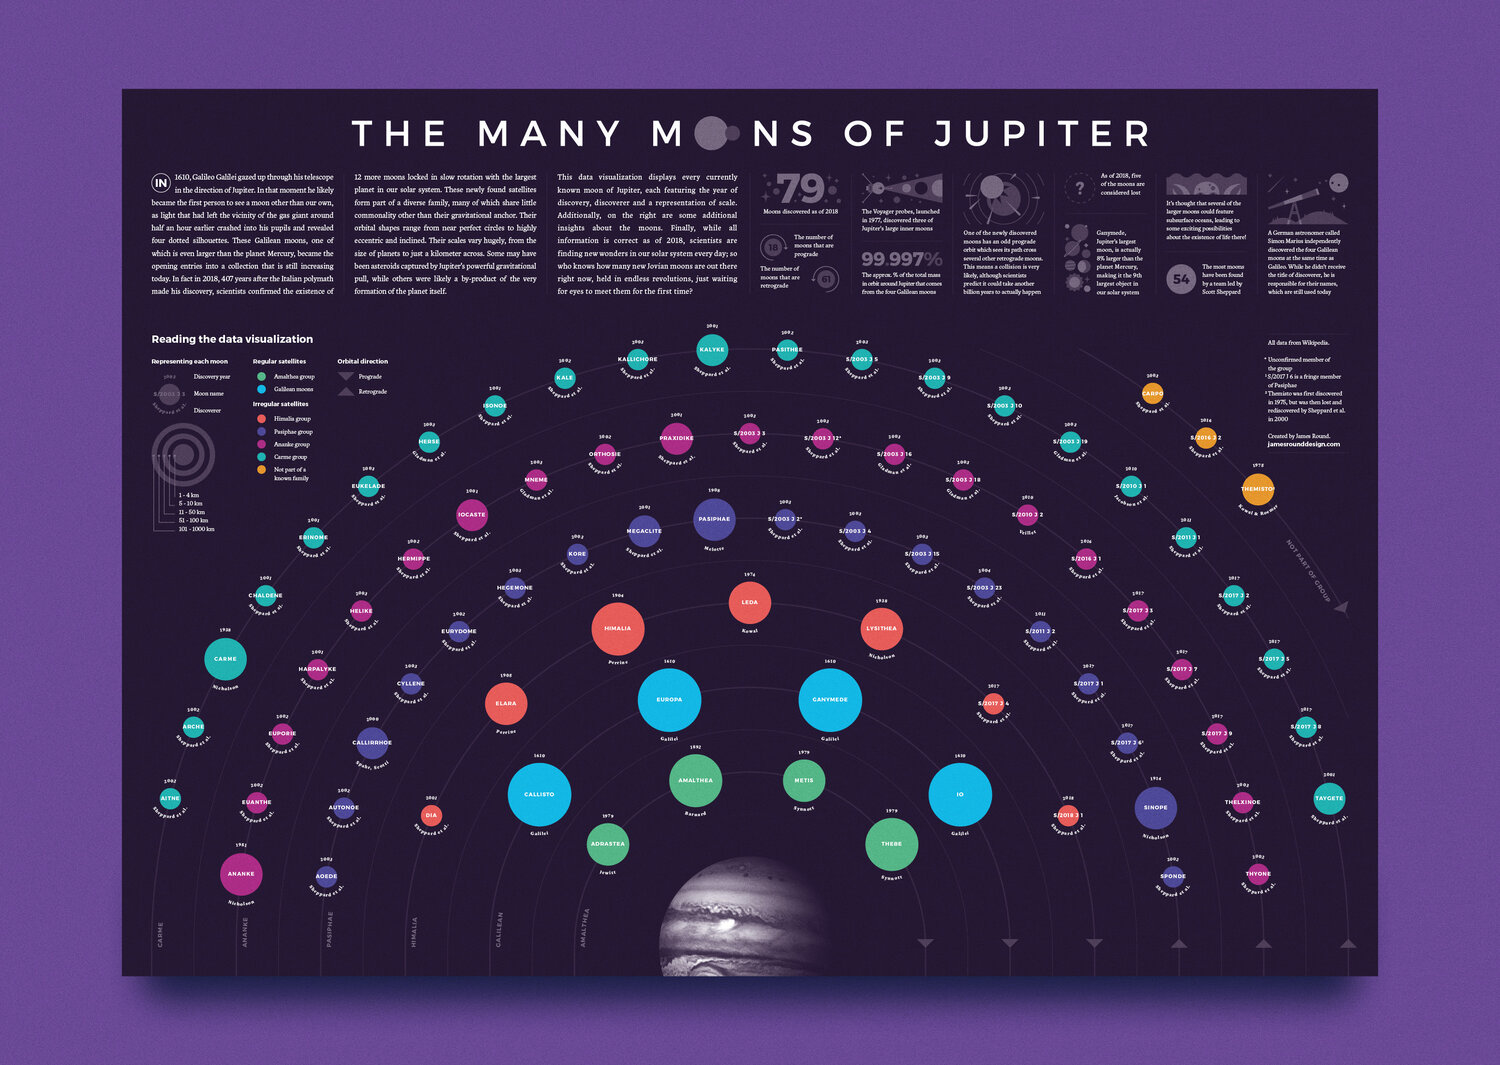
In the above data visualisation Round maps all 79 known moons of Jupiter. I think the level of detail included in this infographic is incredible. I love the use of colour, images and icons to display the data. I also think how the sizing of the circles presenting the moons in the above outcome reflects the actual scale of the moon is really cool and would love to include a comparison like this in my own work.
I also love the delicacy of the colours used to present the information, figures, icons and illustrations at the top of the infographic. I feel that this was a really great way to include lots of information on the final outcome without detracting from the key information.

To see the full infographic click here
Above is a longform infographic created by Round displaying the deadliest stated for cyclists and also the reasons behind cycling fatalities. I think the colour palette used in this outcome is incredibly striking and really helps the information to jump out from the page.
This is an incredible outcome and is interactive with animations and hover features that really aid in the telling of the story e.g. the infographic begins with a large grid filled with yellow squares, as you hover a mouse over the squares they turn white and reveal an icon of a cycle and when you click the square it reveals the name age date and location of an individual that was killed or injured by a driver while riding a bike.
The deadliest states are highlighted on a map with figures showing the percentage of cycling deaths that happened in these states between 2014 and 2018. Information is also highlighted in pictograms, bar charts and line graphs to name only a few of the outcomes. The final result is incredible and I would love to be able to present my data as clearly as this.
Peter Grundy
Peter Grundy is an illustrator and designer that specializes in information design.

Above is one of Grundy’s outcomes that focus on letterforms. The above outcome presents the death reposts for a single year and was created for the magazine men’s health. The outcomes used to represent the various causes for deaths are really imaginative and the way the final outcome results in the presentation of skulls sets a slightly lighter tone for otherwise pretty shocking and upsetting statistics.
The result is really compelling drawing the viewer in and encouraging them to take the time to find different facts and pieces of information. I also like the colours used and how small spots of colour really draw the viewers attention to specific areas in the outcome. I also love how Grundy presents letterform in this outcome and helps numbers to stand out by displaying them in white and the rest of the text in a light grey.

The above outcome is one of my favourites by Grundy and displays a map of the London Olympics at a glance. I love this really illustrative outcome and the sense of order created by Grundy as well as the simple graphics that communicate clearly what they are presenting even at a small scale and playful topographic element such as the run displayed towards the top right. I would love to great something as dynamic and illustrative as this however I’m not sure my topic lends itself to this type of outcome as a lot of the content is more abstract as difficult to present as a visual.
What have I learnt?
- The approach to data visualisation may vary depending on the audience.
- When presenting data you are telling a story and if done correctly this can have a massive impact.
- It’s important to be accurate in data visuals so if there are different sizes of shapes used to represent data comparatively they must be scaled accurately even if the number or percentage is also present.
- Illustrations and strong colour schemes can really add to the overall impact of an infographic.
How can I apply this to my work in future?
- I need to consider my target audience when creating my infographic and ensure that I am presenting the information in a way the will be engaging and clear.
- When creating my infographic or any data visualisations in future I need to consider the story behind what is being presented and ensure that I am directing the viewer through the story clearly and highlighting the important points.
- I found the interactive infographics really interesting and engaging this an area I would like to develop my knowledge further in.