For this Master/Apprentice exercise, we were tasked with reproducing two bar charts of varying styles. Out of the two, I much better enjoyed the look of and the production of the second bar chart, as I feel it matched the kind of style that I want to go for in my infographic – professional and serious. I did still enjoy the results of the first bar chart, however. It was interesting to try a new style.
Bar Chart 1
The original illustration:

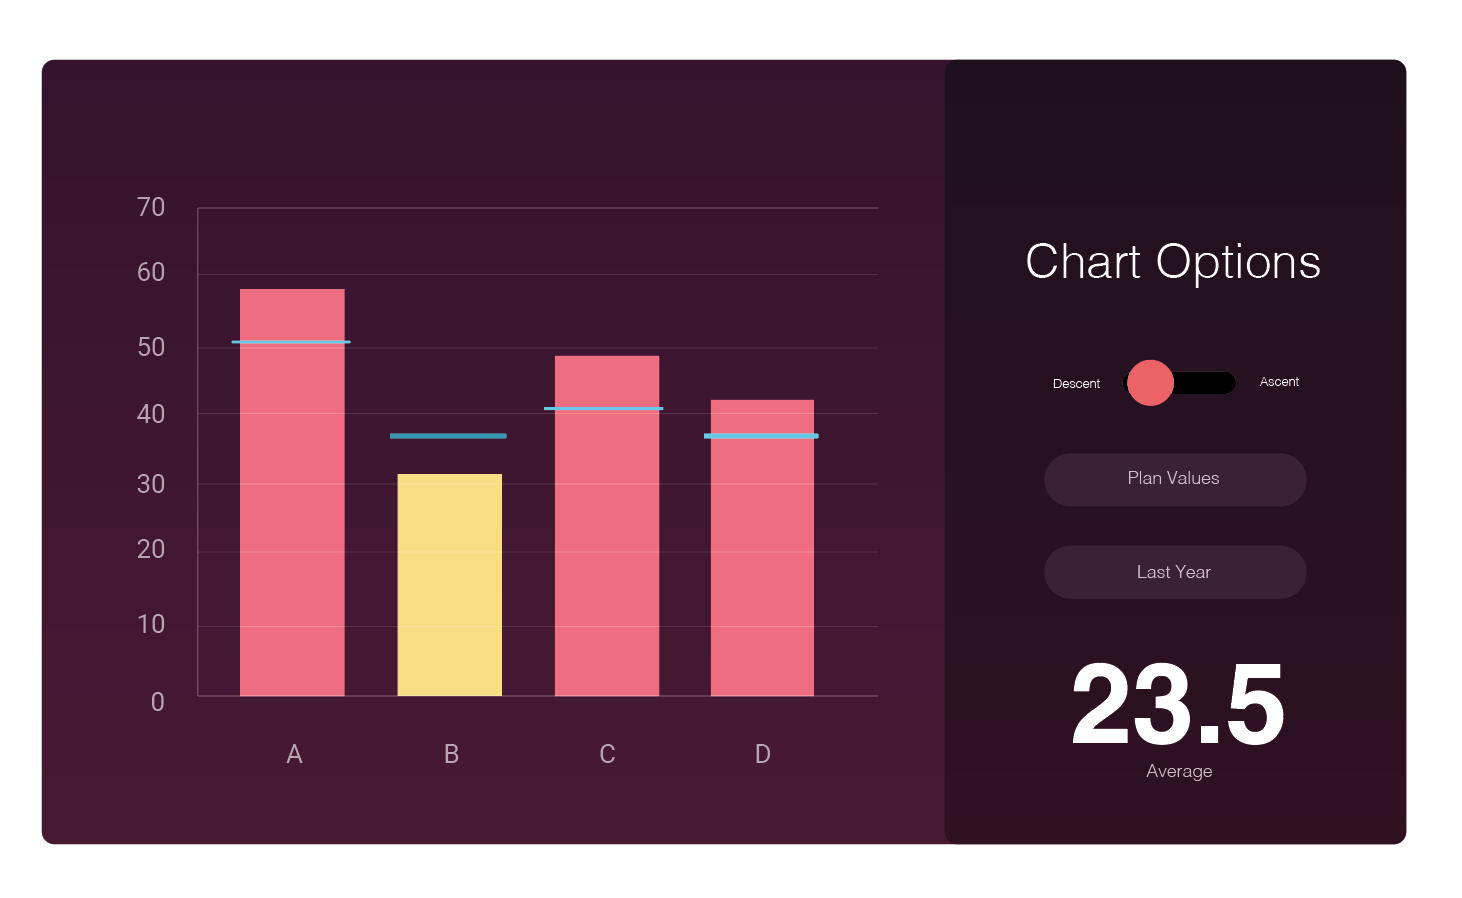
My version:

Bar Chart 2
The original illustration:
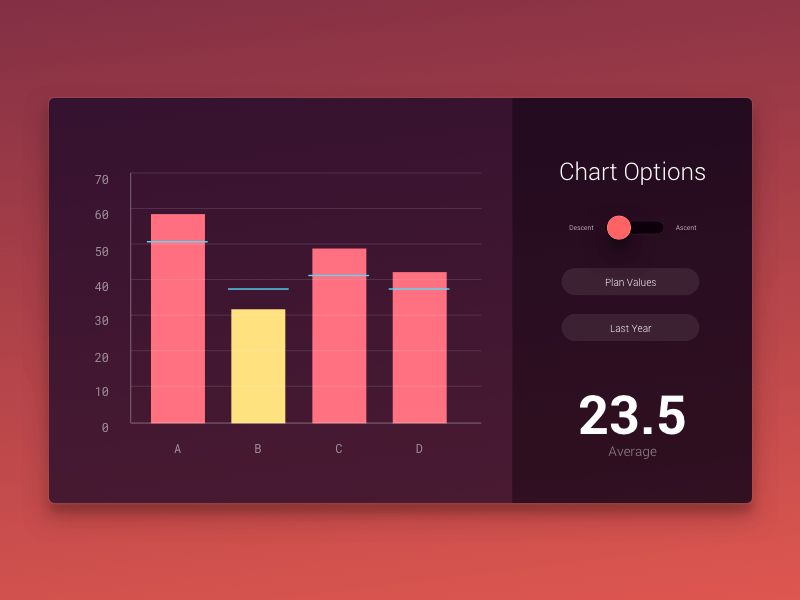
My version: