Data – “facts and statistics collected together for reference or analysis”
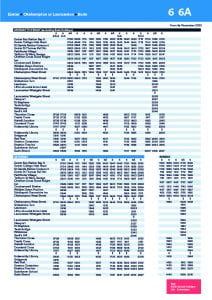
Examples of data in the world around us –
Data does not always have to be displayed in a boring dull way, instead it can be displayed in a creative way using design to make it stand out
Some designers that use their designs to display data –
Data can be used to gain knowledge on something but there is also a down side to data as it can be hidden or twisted
The second project for IXD104 was also given:-
Create an infographic / data visualisation looking specifically
at global population
This class helped me realise how data really is all around us. I knew data was everywhere but I had never really stopped to consider if something was data such as my bust stop timetable. I also realised that data doesn’t have to be boring, instead it can have a life on its own. The last thing I learned is that data cannot always be trusted as some people will try to manipulate it and you by not showing the big picture.


