IXD104 – Manufactured Fictions in the Age of Instagram – Week 9

In this new age we have people who are able to deep fake their face; like the tiktoker who uses this tool to look like Tom Cruise. Whilst this promises great technological advances, it also raises ethical concerns, like for example, will people (mainly celebrities) have to state in their will if they are ok with this technology being used to depicture them in movies or/and advertisement?

The worry with technology like this is the fear of it being used for nefarious reasons.

“We shape our tools and there after our tools shape us” – Marshall Mc Luhan.


When times where good…

Advertisement agencies would sometimes utilize old style recordings or even real recordings from the past to create a feeling of nostalgia and evoke that feeling of history, memory and of good times. This has been used to increase the popularity of companies like:

  • Jack Daniels
  • Lego

Stairway to heaven

The three little pigs

Moby Dick

The turtle and the hare

  • PlayStation: They included PlayStation branding throughout the video. They created the feeling of nostalgia by keeping the same owner and showing him and how he grows over the years enjoying his PlayStation….

Citizen Journalism

The camera used to get the photography doesn’t always have to be an actual photography camera; sometimes using a phone camera can be more effective than using a big photography camera.

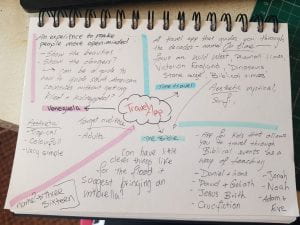
This form of documenting gives a clearer and in some way more honest view of what is actually happening in the word. It brings to mind my time in Venezuela; in my home country the media is run by the corrupt government so the poverty, hunger and violence would not ‘officially’ leave the country, the only way news got out was by citizen journalism, by keeping family abroad informed and by posting the horrible acts of violence and crimes against humanity the government would commit on a daily basis. This form of ‘journalism’ would reduce the feeling of disconnections we would feel from the rest of the world.

Social photography arose from this new style of reporting.

Artist who have played with nostalgia

  • Nick Lamb – used an iPhone to photograph a baseball team. Its the vison not the tools.


Apps like Hipstamatic, Flicker and Pictory are great for playing around with photos and nostalgia – I would love to play around with Hipstamatic especially. They were popular before the rise of Instagram. In a way they had more depth as they were about appreciating the photos posting instead of just consuming mases of information (Instagram) In a way Instagram has turned us into exhibitionists and layers. We have become masters of our own fictions – it’s hard to tell what is and isn’t real in Instagram; many people believe what they see, they are obsessed with following. Influencers have managed to create a very lavish lifestyle, eg Mrs Hinge, Kim Kardashian, Contestants of love Island, Logan Paul.

It’s not all happy though, through the rise of Instagram, peoples mental health issues have also been targeted in a way – imperfections are highlighted . Morally influencers need to consider the effect they are having on people and why they are ok with causing this kind of disruptions in peoples life.

@sociallybarbie – This photographer from Portland created an Instagram account depicting the adventures of a Barbie to show how hollow and empty the iconic, millennial adventures really are…

Virtual humans/influencers

  • Miquela Sousa – She is in most social media platforms and would be considered and influencer!? She has over 3m followers.
  • Bermuda Bay – She would have a link in her bio to encourage people to vote.
  •  – First digital model

The danger of all of this is that people are being influenced by an unknown entity; Miquela isn’t real, but the people who created are. There is a lot of strength behind them but it brings into question what is and is not real?

Take a look at these fake people generators

  • …..
  • Generated photos

************* ADD LINKS *************

IXD104 – Visualising data – Week 7

The end result is important but the progress is vital, it must be included at all times when handing in work.

IXD companies

  • Rapid7

Research blog

  • Loads of exploration
  • Not only links, also written thoughts

Data is all around us

Edward Tufte – the father of data visualisation.

The trick is finding the right type of data and presenting it in the right way.

Visualisations

Artists to look at

Software that helps

  • Processing
  • Illustrator will help you create these with your own data

Books

  •  Dear data
  • Designing with data by Brian Sudan

We can reveal or even hide data through design – slight of hand really. Apple have turned and tilted pie charts before to make their numbers look better and higher than they actually are – this is a clever slight of hand.


Project 2 (30%)

Create an infographic/data visualisation looking specifically at global population. Research the subject of data visualisation and infographic

possible approaches

  • births and deaths in the world – past/ and/or present    —–> ties in with the census    IDEA: deaths and births since the beginning of the pandemic and also point out causes of deaths
  • population   —>  Easier one

Research and supporting material is worth 40%

Master apprentice

Redraw a chart for week 8

Illustrator will help you create these with your own data


IXD104 – Feedback – Week 6

30% of the module grade is based on the app

Formative feedback

this is a low-stakes opportunity to promote and measure your knowledge and skills; it’s a great way to find areas in which you need to improve.

Peer feedback

This has somewhat been lost for us due to not having the studio experience, try to do this digitally as much as possible. It’s a great way to learn from each other.

It’s about providing a mirror for others to reflect on their work/performance so they can identify improvements that can be made. It’s an awesome way to become more efficient.

The sandwich approach

Begin your feedback with positive, share your criticism and end your response with something positive or encouraging. Be CONSTRUCTIVE never negative

Feedback

Visually it looks good, likes the wave.

The type is heavy for the fun facts  – try a lighter one

The headings are nice

Apply the little bullet point symbol

Line up body text alongside the heading – spacing to the left in Jonah is ok but o the left its off

Keep the margin if you will the same

The text is hard to read on the wave – it does not stand out well

The arrow steams should be thicker

Could imply that there is more content bellow

I then took the feedback on board and made the necessary changes

This is what the changed screens looked like

IXD104 – Image and data visualisation -Week 5

Rubric review

You need to post your research to gain the marks, even if it is evaluations of failed attempts, this is also important. Your choice of imagery MUST fit your theme and overall feel, eg if you are travelling through the Amazon yet your illustrations are rigid and architectural instead of flowy.

Pay attention to the research guidelines as ignoring or underestimating them will bring you down a few mark brackets.

Research —> Go find your own, don’t use the same as everyone else.

Tying things together

——————— Critique next week via Miro (week 6 – 05/03/21) ———————

Need to have done

  1. Three screens
  2. Consider action buttons, icons, illustrations/sections  that can function through
  3. Icon set ( master apprentice and your own )
  4. Cityscape (master apprentice and your own)
  5. UI design idea on paper and digital

—–> You can try to animate the graphics if you have time <—-

Can talk about the flow or animation as part of your design ideals

Principles of UI

Formatting content – the flow of the content needs to fit the device the information will be viewed on

Touch controls – these can make the interaction with your app feel easy and natural, user friendly .

  • Jacobs law: Users spend most of their time on other sites; meaning that users prefer your site to work the same way as all the other sites they already know.

Hit targets –

  • fitt’s law: the time to acquire
  • Law of Pragnanz: people will persieve and interpret ambiguious

Text size –

Contrast –


Distortion –

Organisation _

  • Hick’s law

Alignment –

Touch screen sizes – The smaller the target, the harder it is to hit/select. Look at icons of apps you use all the time and notice the size of their icons. The sizes will vary depending on devices eg Apple 44px, Microsoft 34px and Nokia 26px.

Using the finger pad comes natural but it covers the entire target area; using the finger pad shows more. Index finger and thumb overlap on to neighbouring targets when they are grouped, resulting in users accidentally triggering different actions.

The average pixel width of human finger is 57 pixel touch target – wider than most guidelines. A small target slows users down as they have to pay more attention.

The average pixel width of a human thumb is 72 pixel touch target – the thumb will fit snuggly into the target area, target edge gives visual feedback.

Placement of information is also important.

Using the correct finger size can be ideal but not always functional.

Colour –  helps users see and interpret the information and understand actions within the app. Target audience MUST be considered for this.

Colour scheme standards

  • Monochromatic: can have a sophisticated look
  • Analogous colours: This can be useful for a weather app for example or to give priority eg red most important – yellow least
  • Complimentary: Can help make elements stand out, eg messenger (green) using red to show notifications. When the human eye sees a bit of red on green the eye will be drawn to it.

Useful programs:

  • Adobe colour – it can even tell you if people with different degrees of colour blindness will be able to fully operate the programs without being hindered by the colour.
  • webaim.org – contrast checker

Impact of colour contrast:

12

Contarst and redability:

13

Contrast ration:      1:1 – 21:1

14

small text 4.5:1

large text

Contrast and user attention – Used very effectively for marketing

Von Restorff Effect: when multiple similar objects are present

15


Tasks:

  1. Tying it all together
  2. Finishing up UI design in illustrator/sketch/Figma —> NO Photoshop! ( look up UI kit in figma) Unsplash is also good for images of people holding phones or just look for smartphones mockups.
  3. Think of presentation – use flat screens for the presentations and use the mockups for your portfolio
  4. Have 6 finished screens
  5. Research blog — it’s worth 40% of your grade!!!!!

IXD104 – The interface – Week 4

Should have done and posted

  • master apprentice exercises
  • mind maps
  • initial sketches
  • Research

————— Week 6 group critique and hand-in ——————–

It’s important to separate yourself from your final product to evaluate it – Is it functional? Does it answer the client brief?

The interface

  • A minimal, consistent colour pallet can be quite successful.
  • Show the design inside your selected device
  • Try not to make it too typographically busy
  • Create a brand for it also
  • UI cards

— DO NOT use photoshop, stick to Figma and illustrator —

Why illustration in UI?

A picture is worth a thousand words.

Illustrations can clarify by giving examples. It is a great way to convey ideas.

It is an efficient way of providing info to the user quickly and to many.

Think of onboarding screen of McDonnalds – great example.

Tips for sketching interfaces

  1. Its not about being a good artists but a good thinker.
  2. Use a thicker pen – forces you to draw bigger and eliminates unnecessary details – Sharpies. It’s about getting the ideas down as quickly as possible at the beginning.
  3. Draw straight lines – it shows confidence. Practice by joining dots and making circles – eventually muscle memory will kick in.
  4. Be thoughtful about colour
  5. Make them comprehemsive
  6. use the right equipment – muji fine liners look up, dotted paper can be helpful.
  7. time yourself – try doing crazy 8th – fold a piece of paper into 8 and spend 1 minute create a quick scketh in each sections

Illustration should be

  • Meaningful
  • recognisable
  • claryfiable
  • attractive
  • improving of the user experience and usability
  • not overloading the page or screen
  • Harmonic and corresponding with general stylistic concept

They can solve problems

  • Mark Boulton ( typographic designer ) Understand the problem, thoughtfully considering the client, the business, the market, the goals, the audience
  • Look at Apple website and how they narrate and use storytelling through visuals to sell their products
  • Quentin Blake

Mascots and characters

  • They can add a personality to any brand or product
  • Meomi look up
  • Can be iconic
  • Can be diagrammatic
  • data visualisation
  • Hyper realistic
  • Simple vectors
  • hand drawn – can add a certain charm

Illustration for UI

  • Onboarding – great way to introduce people to apps – eg tutorial pages
  • They can be used as achievement badges
  • Consider the audience and what approach would be appropriate
  • They can be simple and gently – don’t overdo it with gradients – it can become overpowering

Research

  • Focusing too much on one area can cause you to have a narrowed focus. Search different varied sources, this way you will develop a more diverse approach.
  • google image
  • Flickr
  • Dribble
  • StumbleUpon
  • Pinterest
  • Blogs
  • Brand guidelines
  • Books
  • Sketching – always start on pencil

Book recommendations

  • Visual families

Tasks

  • Netflix abstract tv show is a MUST watch. At least evaluate the Ian Spalter: Digital Product Design episode.
  • Create icons
  • Consider UI
  • Create visual mock ups from your wire frames (Illustrator/Figma) minimum of 3


IXD104 – Hand to mouse – Week 3

This course does not create illustrators but if  you are passionate about it then pursue it! Practice makes perfect.

Reminder:

Research 40% is all blog and backup work — Get on it!

Alex, Ethan, Georgia, Jessica —> IXD students to look up

What is illustration?

Anything. A visual material.

  • Marion Deuchars (traditional media) look up Samsung add
  • Dan Fern (Photocopier)
  • Love Fraud (short film) – Oliver Sax
  • Martin O’neill (Collage)

Now we have illustrating digital tools

  • Olly Moss
  • Jorge Colombo (Procreate) – Very architectural
  • Rogie King (Vectors) loads of icons, simple and clean.
  • Nigel Peake
  • Breno Bittercorp
  • Sarah Parmenter (UX/UI)
  • Veerle Pieters (UX/UI)
  • Von Glitschka (Linked in learning)

NI Illustrators

  • Oliver Jeffers
  • Peter Strain
  • Atto Partners
  • Jordan Henderson
  • Paddy Donnelly (IMD course student) Used textured papers and then digitally added elements onto them. Book covers.

Tools available

  • Pens, pencils, paper
  • photocopier
  • photoshop
  • Collage

Task

  1. Recreate the city scapes ( master apprentice exercise)
  2. Mind mapped ideas
  3. Sketching and wireframing
  4. Start creating your icons.

Tutorial with Paul

Need to ask:

  1. Is my bible app travel idea valid and explain it

Feedback:

Likes the idea.

make it so its a window into the event – time travel sort of situation.

tablet format instead of phone so its more appropriate – more kid friendly – maybe put it inside one of those tablets with the handles for kids.

Time travel taking kids to biblical locations.

cutitout.co.uk

IXD104 Icon design – Week 2

Research/Inspiration

Icon design

Understand how they are created, they are a big part of design systems – even if we don’t design them ourselves. It is about trying to capture the essence of an object in its simplest shape.

Try to restrict yourself to a tight grid – eg 10×10 to push your creativity. Only use circles, squares, triangles and find out what you are able to create. Using a limited pallete can also be helpful.

Icons have History – eg the stone age, the Olympics

Icons are language Agnostic – understandable globally. Think IKEA clear.

When making icon set make sure they are consistent in colour, line width, fill, thickness, etc.

You find icons on your phone, the airport, they are everywhere.

When using icons for a navigation system, it is a good idea to have the icon window you are currently in to be filled in as it aids navigation – eg think of how Instagram fills in the house icon when in the home page.

Icons are now an integral part of visual identities, program interfaces, information systems, websites and mobile applications.

Using mind maps as research are  a great way to show your thought process.

Remember when creating forms, different forms and gestures that are accepted culturally in your country may not be accepted in theirs. Be respectful. Do your research.

Style

  • Outline icons
  • Glyph icons
  • Han-drawn icons
  • Filled icons
  • Flat icons
  • Skeuomorphic icons

Scaling

38mm – 48px — 80px — 172px

Consider scaling carefully as it needs to retrain its shape and detail if made bigger or smaller.

Required reading

  • The icon handbook
  • Material design

Task

  1. Make an icon set for your travel app
  2. Where am I going with my idea? eg travel through the body? time? Space? the Ocean? the world?
  3. Mind map like crazy
  4. Create a simple paper/Miro wireframe – or both?

Icon recreation

We were encouraged to take a master–apprentice approach to our studies and development as artist; searching for artists and in some cases reproducing their work to learn new skills and improve.

We were tasked with breaking things down, analyzing and reproducing them.

I will now reproduce an Icon set given my my professor; that I could use for my Project 01 (travel app) or simply just as a learning experience. I will be using figma to complete this task.


I began by attempting 3 of the blue icons, bellow are my outcomes.


OK, so I made them supper small ( Clearly I didn’t think it through) and so when I made them bigger they became pixelated – It was really annoying as I had done quite a few in this way which meant they were no good. In a more positive note, I learnt an important lesson.


I wanted to really challenge myself so I attempted to do the map from the second set of icons; this one was more complex than I thought as there were curves involved in the design. Overall I am quite pleased with my final outcome. I need to practice more as they took me an embarrassing amount of time to finish.


IXD104 – Image and data visualisation – Week 1

Image and data visualisation

We have heard before ” a picture is worth a thousand words ” but by exploring non-verbal forms of communication we can introduce illustrative and diagrammatic approaches to communication.

We can even go as far back as the stone age where images were used for communicating; by paintings in caves.

One can’t read a picture but pictures can have a narrative when combined – they can even tell a story. Juxtaposition (making the ordinary look extraordinary, it represents one of the essential techniques in the Surrealism art movement.) can also be used on images to make new stories or narratives possible.

The aim is to not only create images but to also brief others through the creation of illustrative assets – conveying information effectively through imagery.

All images communicate.

Look up

Module breakdown

20 credits –> 200 hours –> 38hrs a week

  • Illustrative (30%) —> Icons and app – week 1-6
  • Diagrammatic (30%) —> Infographic – week 7 to 12
  • Blog (40%) —> research, discovery and backup work. Reflect on what you have covered in class, write and evaluate, research relevant designers/illustrators.

Book recommendations:

  • Data driven graphic design
  • Dear data

Remember to:

  • Break things apart and analyze them.
  • Break illustrations/drawings/images to their most simplest form to analyze them and learn.

Task:

  1. master –> apprentice approach, finding artists, reproduce and learn from their work.
  2. Breaking things down, analyzing and reproducing.
  3. Icon set –> create 5 icons that you can use in your travel app ( does not have to be travel in earth ) week 1 and 2. Eg space travel – retro feel? Travelling into the depths of the ocean. Think of travel in its broader term. Travel around town to encourage home tourism? DO YOUR RESEARCH!!! state your desired audience and design and plan it towards it.
  4. Redesign the icons given from the 2 sets and recreate them in simple shapes first.
  5. Research travel apps and what kind of place you would like to base your app on – be as imaginative as possible.
  6. Identify some travel app designs, highlight what it does.
  7. Mind map and development of ideas must be shown

Travel app

  • needs 3 screens (home/launch screen, a city/country/planet, details on the place
  • Working prototype

There will then be a group critique.


Semester 1 quick feedback:

  • Need more research – it was lacking in some areas – Needs to  be updated more constantly.
  • Alternative for WordPress – Tumblr ( but not covered by university ) or Notion –> if you do switch over then put a link to it from your campus press.