Idea Generation
What is my brief?
-To create an infographic based on global population.
I have completed a range of research for my infographic project so far and now I need to generate some ideas and choose a topic to base my infographic on. So to help me decide I have created a Pinterest board based on infographics and this actually helped me to generate a lot of ideas that I could take and explore further, this exercise got my very excited to begin designing my own as I saw a lot of inspiring infographic examples. I in particular favoured the environmental examples I think that this has a lot of potential for some nice designs and interesting data images.

Pinterest board link- here
Paper first
I still wasn’t sure what type of infographic I wanted to make, so I took to the sketchbook and began to explore some possible ideas.
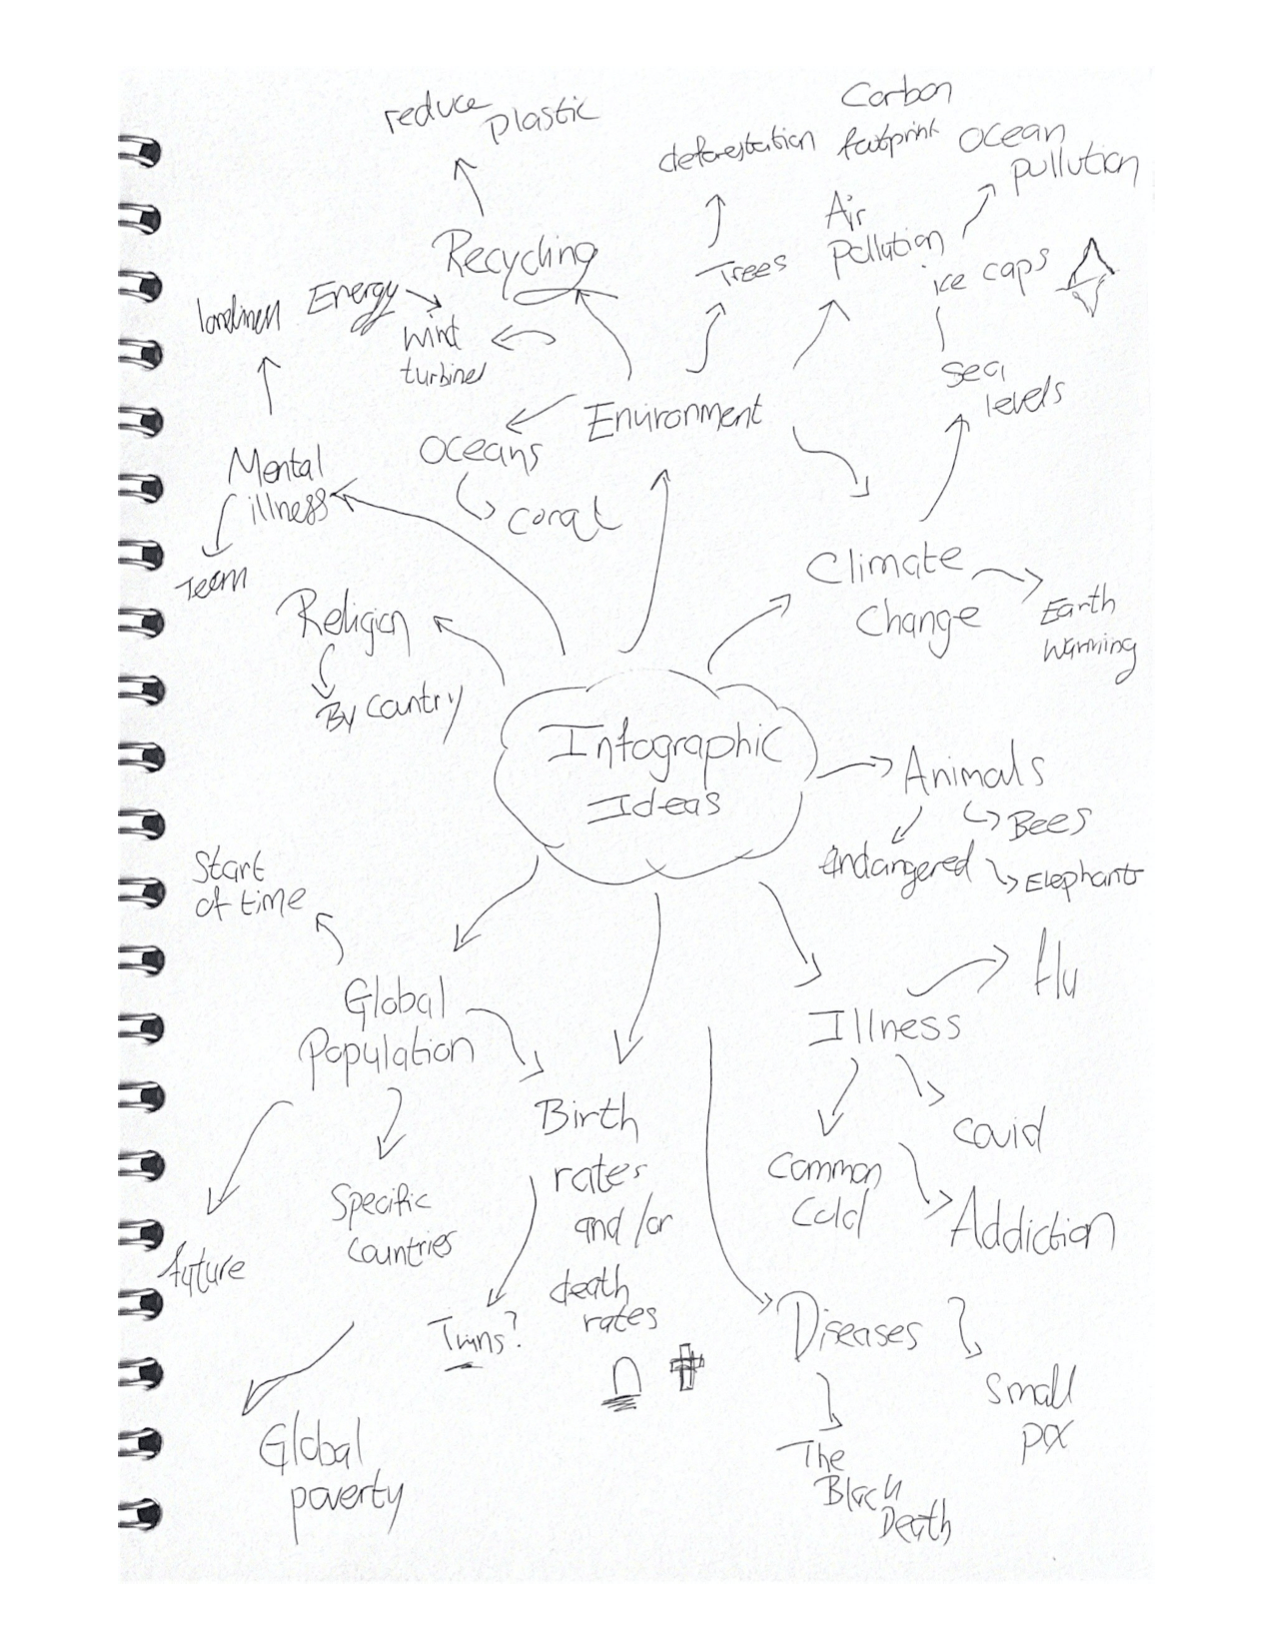
I am very interested in the environment and I feel there are a lot of ideas and paths I could take within the idea of the environment, I decided to take this and generate more ideas that were specific to the enivironment. I have included this information below.

Content Planning
Final decision- Trees
After much deliberation and questioning I have decided to go for an infographic that is based on trees, I live in the countryside and I have been surrounded by so many trees my entire life and I have always had an interest in them. I want this infographic to show the importance of trees in our environment and why we as humans need them to survive. Our brief is to create an infographic based on some form of global population and with the subject of trees I can include interesting statistics about trees worldwide. I went to Miro to create a mind map out of all of the possible topic ideas that I could research and include within in my infographic that are specifically about trees.
Possible topics I could include that are surrounding the idea of trees

This has narrowed down my research list, and I now have topics to focus in on in more detail. I will research each of the topics again and then go through them with a fine tooth comb to choose the best facts and data to include into my infographic. I will read articles and perhaps look at some documentaries based on trees and their importance to this environment.
My desired design approach:
I have researched a lot of designers espciialyl infographic designers and I know that I want to go down a illustrative path for my infographic. I want my infographic to :
- explore a flat design illustrative style
- have earthy tones that represent nature and trees
- intersting visuals that arent confusing to read
- important and shocking facts in bold, not too much text
- enjoyable to look at and read!
Choosing an illustrative style
I have done some quick sketches of the type of illustrations that I want to include in my infographic including swatches of potential colour schemes, I based these sketches from the above mind map topics.

I will experiment more with more sketches based on the topics I have talked about above and do some more research about different flat design styles and approaches I could take.
Infographic elements I want to include:
- pie chart
- bar chart
- scatter diagram
- larger facts/ statistics in bold
I don’t want to include over complicated data elements, I want to keep these simple and easy for the reader to read and understand and ones that make sense to pair with a topic such as trees. I will do a separate post about how I will create the data portions of this infographic and talk about them in more detail.
Typography
Choosing the right typography for my infographic is a very important aspect that I need to get right. It is so important because this is how the readers will understand the information, it needs to be easily understood and nice to read. I will need to choose the font when I begin my digital development to see if it is an appropriate choice alongside my illustrations.
What is next?
- I need to begin deeper research into trees and start to gather lots of facts and statistics about this topic.
- I need to make a number of different wireframes- paper and digital.
- I need to choose the right typography for my infographic.
- I need to begin sketching in more detail about the elements and illustrations that I want to include.