Week 8- Designing Infographics
Paul discussed all things infographics in week 8 and how we should go about designing our next project. He touched on a number of topics regarding this project including the process of how to create an infographic and research points I should consider looking into, this included some artist inspiration and books I should look at, he also talked about our tasks for the week ahead.
Beginning my research
Pinterest research

I have began my research process with looking at Pinterest and I have created a mood board that is based around infographics-
Link here- Infographics board
I have also created a Pinterest board on different data visualisation design approaches including pie charts and diagrams, this board includes a range of styles and designs-
Link here- Data Visualisation board
Step by Step process
Below I have created a flow chart in Miro that clearly lays out the step by step process of how to create an infographic and I will revisit this post and proceed to follow this approach and process when designing my infographic.

A key point that I got from this lecture is that I am telling a story with my infographic, no matter what topic I decide to base it on I am telling a story with the images I create and the statistics and facts I include within it. I also learned that I should focus more on the images/ illustrations I include as a ‘Picture is worth a thousand words’, I shouldn’t add too much information and statistics into my infographic as I don’t want them to over power my piece and be too boring. I need my imagery and information to fit together and compliment each other.
Different design approaches my infographic can take:
- Hand drawn
- Photography based
- Digital illustrations- including illustrator vector designs
Master Apprentice
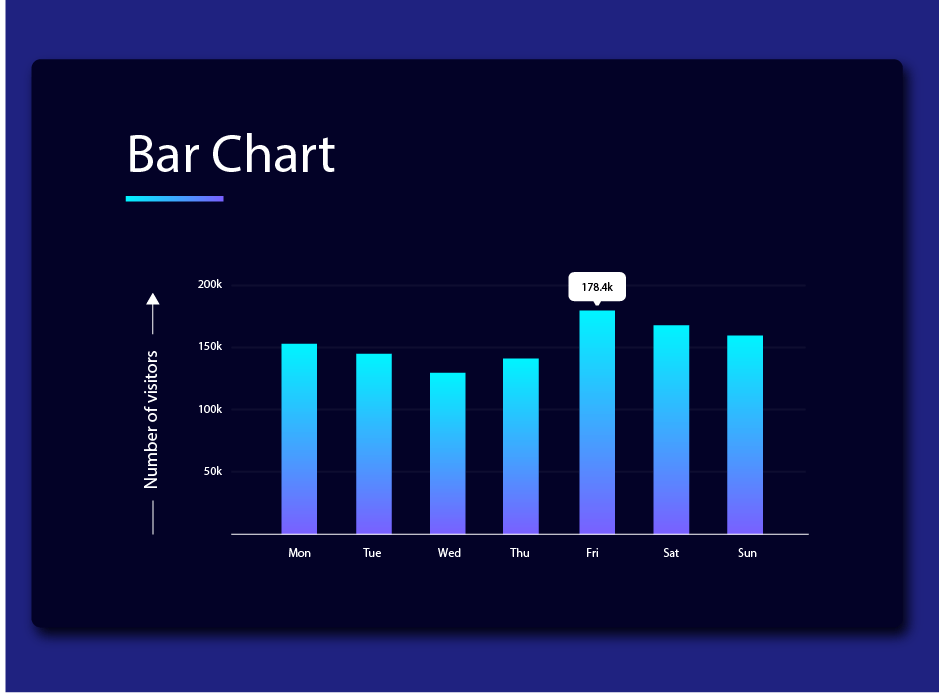
One of my tasks for this week was a few master apprentice exercises that were all based around bar charts, here is how my re-creations went…
Assigned bar chart

My re-creation

Assigned bar chart

My re-creation

Assigned bar chart

My re-creation
Extra re-creation
I have included an extra re-creation of a bar chart below, I chose to do this bar chart as it was a different shape compared to the other charts that were set for me to do and I wanted to challenge myself with this different shape and approach.
Original

My re-creation

What did I learn?
Master apprentice tasks are some of my favourite to do, as I always end up learning a lot and I love the challenge of getting them as close to the original as possible and for this challenge I am very pleased with the outcomes of my graphs. These exercises have helped me with getting to grips with the accuracy that comes with graph and number work in regards to presenting data, I know that the graphs and other data visuals that I create for my infographic need to be accurate and visually stimulating to look at.
What is next?
I want to do more research on different artists who specialise in data visualisation and infographics and do some more in depth research about their process, in particular their design and research processes. I want a good range of artists and designers before I begin my own infographic development, as I want the widest range of inspiration and knowledge on this subject area.